A Shared Understanding of Terms Can Be the Lynchpin for Successful ML Operations

A Glossary of Terms for Monitoring Model Drift and Performance

In the world of machine learning and predictive modeling, it is crucial to monitor the performance of models over time. One key aspect of this monitoring is to detect and understand drift, which refers to changes in the value distribution of various features and predictions. To navigate this field effectively, it is essential to understand the terminology associated with model monitoring.In our work with customers, we have seen that teams are often distributed, siloed by organizational structures, can vary in terms of who “owns” monitoring once a model is in production (sometimes it’s the data scientist, sometimes it’s the ML operations team or ML Engineer and so on). Here we attempt to provide a glossary of terms related to monitoring model drift and performance, to help teams navigate the challenges and solutions, in order to drive successful ML Operations.
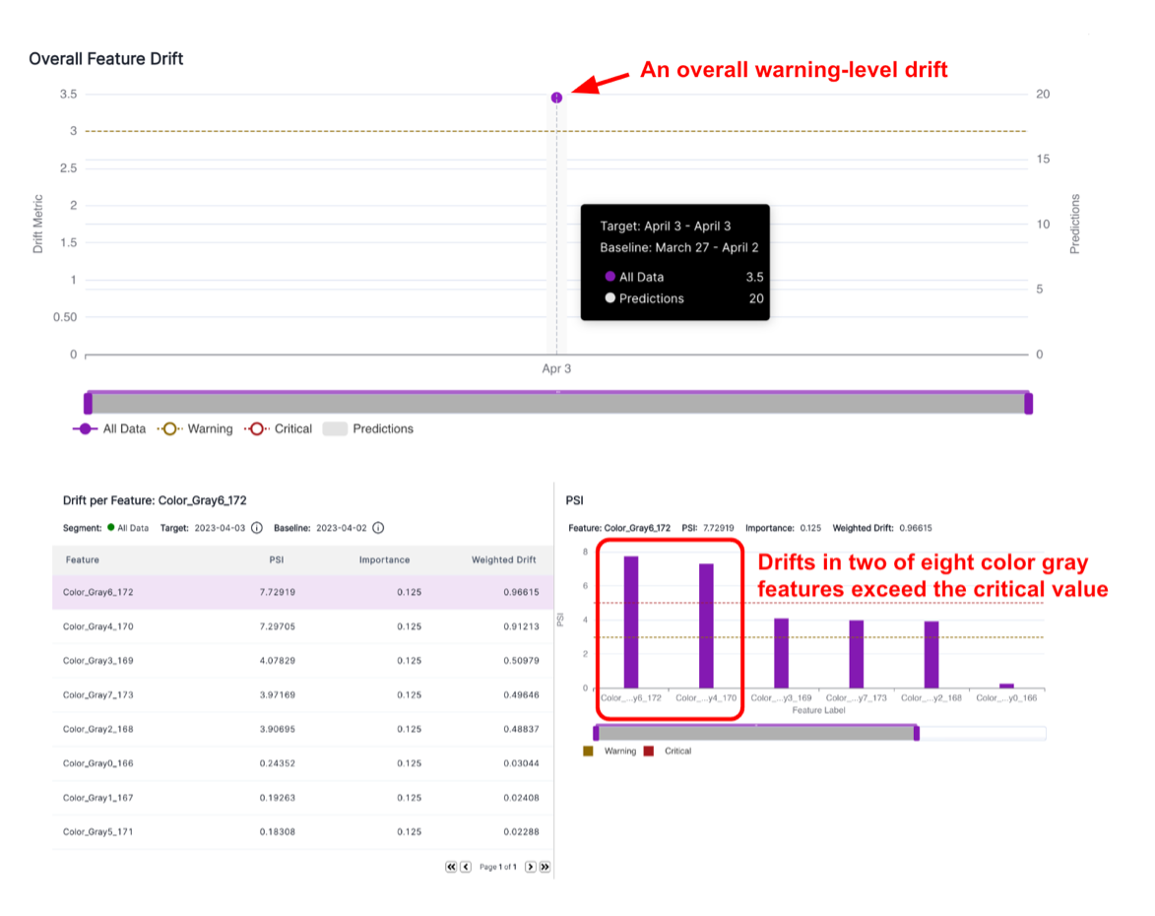
Alert: An alert is an informational flag that indicates when drift has reached a pre-defined threshold in a policy. Alerts come in different levels, including critical (requiring immediate attention) and warning (needing attention).
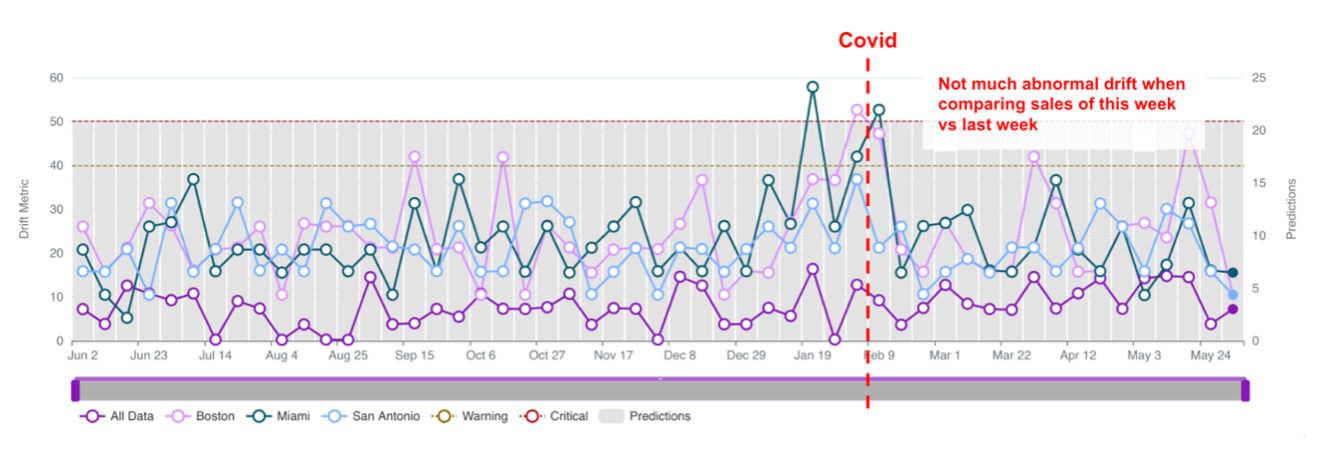
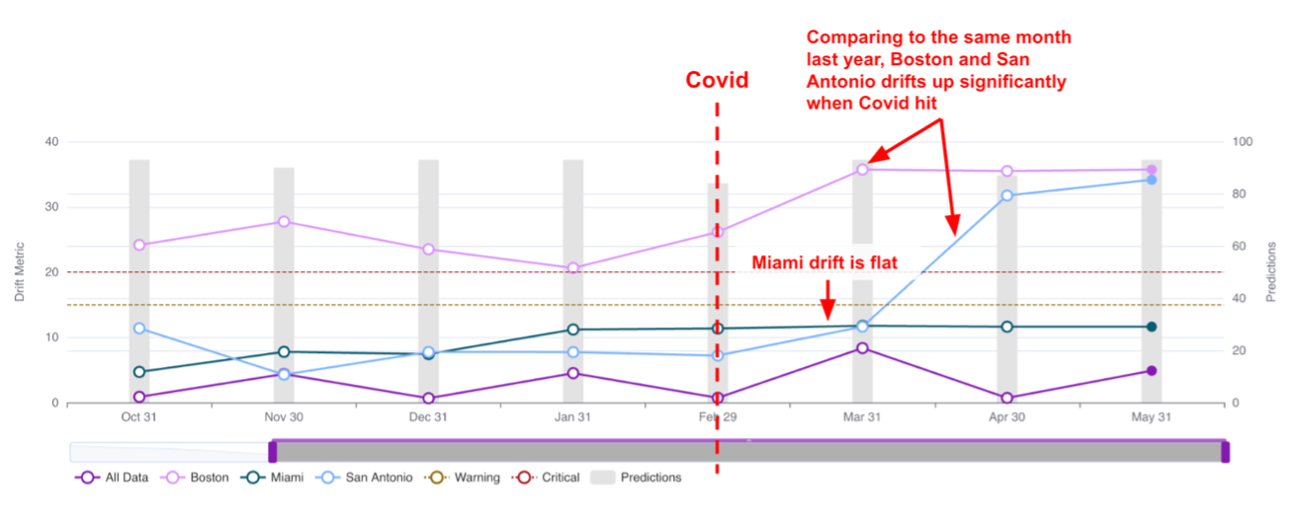
Baseline window: The baseline window serves as a reference point for comparing metrics when monitoring model performance or drift. Baselines can be different types of data, such as training data or previous time periods of production data, like the prior day, the same weekdays of the last three weeks, prior week, prior month, prior quarters, and more.
Custom binning: Custom binning allows users to define their own histogram bin edges. It involves creating a user-defined list of bin edges to group data into specific ranges. Any data falling outside these bins are grouped into the nearest bin based on proximity. By default, a tool like VIANOPS uses baseline decile binning.
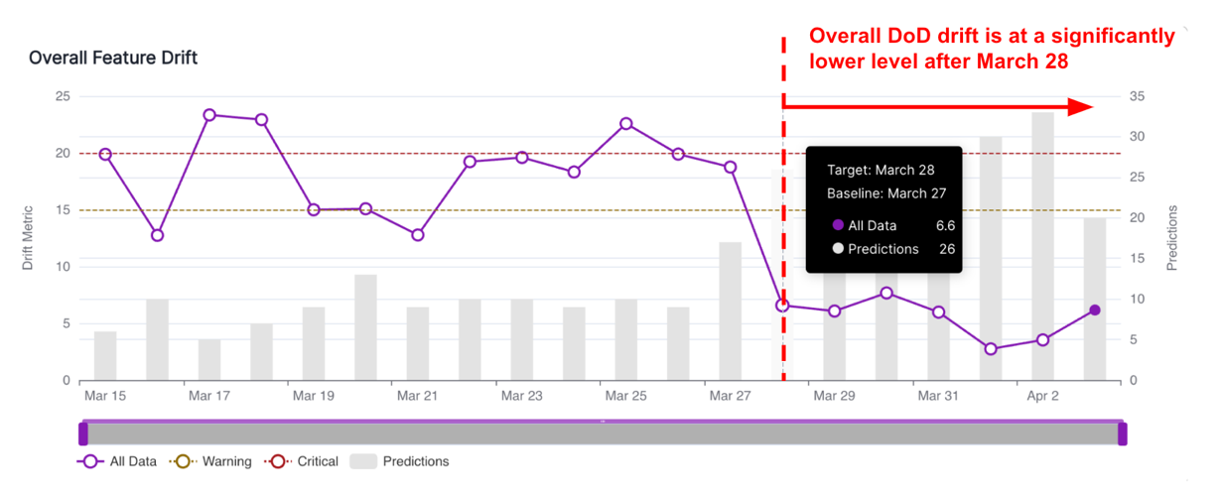
Drift: Drift refers to changes in the value distribution of the target window and baseline window for an input feature or prediction output. It can manifest as changes in the performance of a model or shifts in the distribution of specific features.
Feature: A feature is an input to a model that represents a measurable piece of data. Features can include variables like distance, fare, location, age, and more. Models typically have tens to thousands of features.
Feature drift: Feature drift refers to changes in the value distribution of a specific feature in the target time window compared to the baseline window. It quantifies the changes observed in a feature over time, such as the drift in trip_distance this month compared to the same month last year.
Ground truth: Ground truth refers to the real value or outcome of an event. It serves as a reference point for evaluating the accuracy and performance of predictive models.
Hotspot: A hotspot is a specific area or region within a dataset where an event occurs more frequently or exhibits higher values compared to the surrounding areas. Hotspots highlight areas of interest and potential patterns in the data.
Hotspot analysis: Hotspot analysis is a technique used to identify hotspots within a dataset. It helps uncover areas where certain events or values are significantly different from the norm.
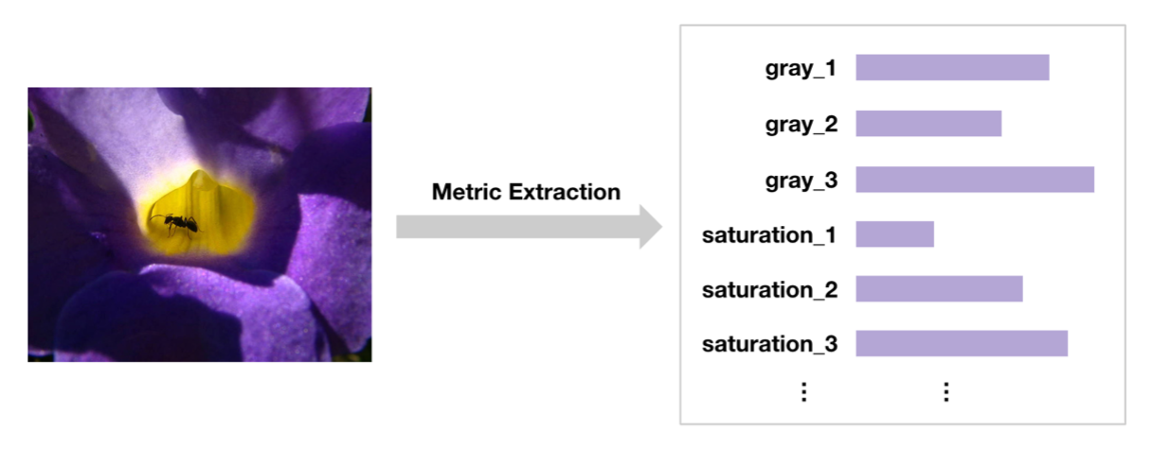
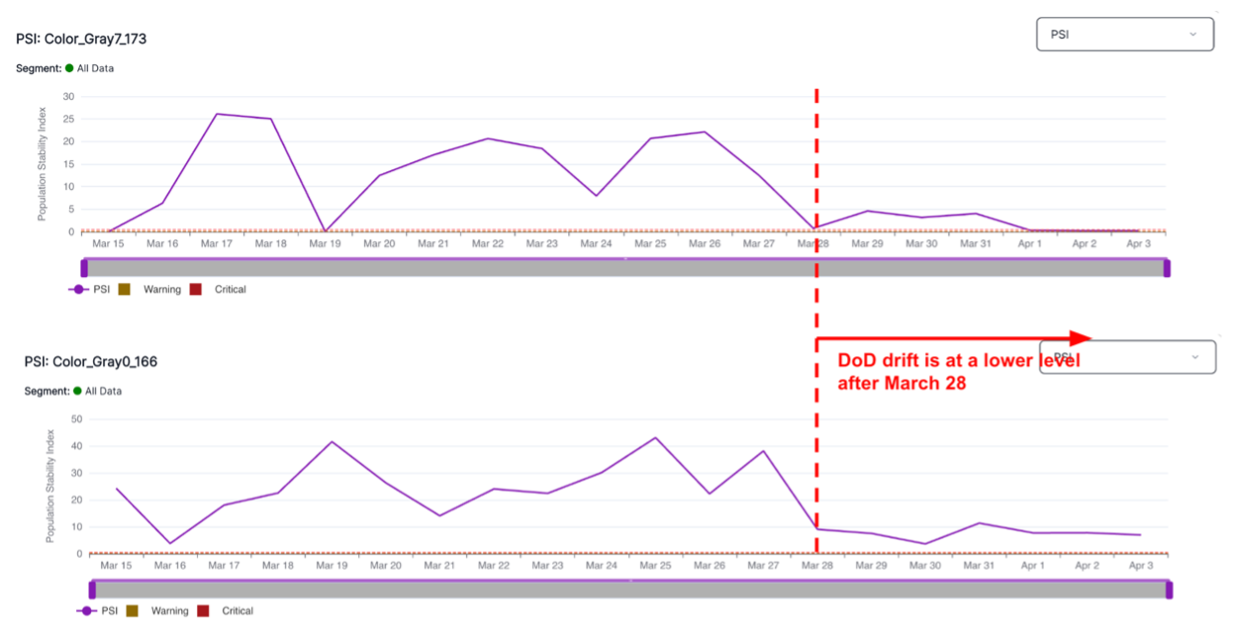
Metric: A metric is a measure used to evaluate policies and model performance. In the context of monitoring model drift and performance, there are different types of metrics, including distance-based drift metrics (e.g., PSI, JSD) and performance metrics for classification and regression tasks.
Model: A model is a predictive algorithm or system used to make predictions based on input data. Models can be binary classification, multi-class classification, regression, ranking, recommendation, or other types, and different model types have specific metrics to measure their performance.
Performance drift: Performance drift refers to changes in the performance metrics of a model between the target window and the baseline window. It quantifies shifts in model performance over time, such as changes in accuracy, precision, recall, or other relevant metrics.
Policy: A policy is a set of rules that define a process for monitoring and alerting users about drift. Policies can be created to monitor feature drift, prediction drift, or performance drift. They include specifications such as target and baseline windows, drift metrics, alert thresholds, schedules, selected segments, and features.
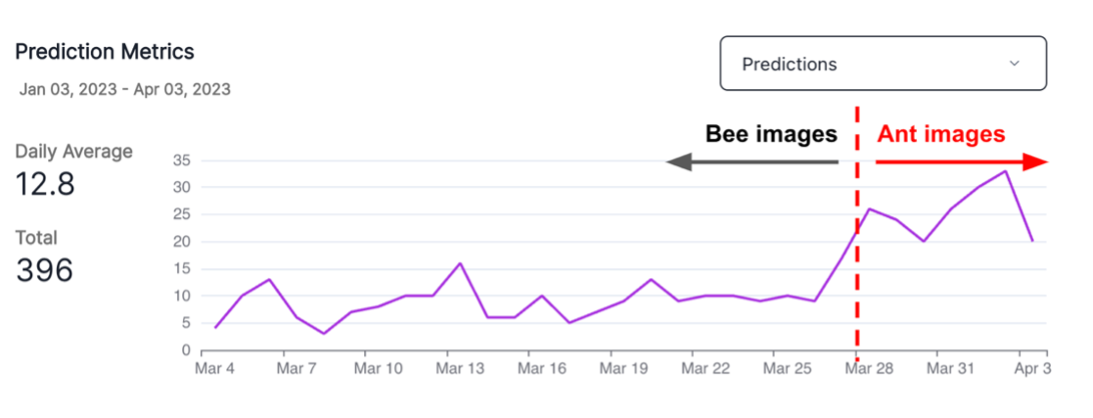
Prediction: A prediction is the output of a model. The nature of predictions depends on the type of model used. For example, a binary classification model may output either 0 or 1, while a regression model produces numeric values.
Prediction drift: Prediction drift refers to changes in the distribution of predictions made by a model between the target window and the baseline window. It assesses shifts in the model’s predictions over time and helps identify potential issues or changes in the underlying data.
Project: A project refers to a collection of models that serve a common purpose. Grouping models within a project facilitates organization and management of related models.
Segment: A segment is a subsection of a dataset used to narrow the scope and uncover patterns that may be occurring only within specific sections of the population. Segments help analyze and compare performance and drift across different subsets of data, such as specific locations, age groups, or other relevant criteria.
Schedule: A schedule determines how frequently a policy runs. It can be set to run daily, weekly on a specific weekday, monthly on a specific day, or other customizable intervals.
Target window: The target window refers to the timeframe of data being monitored. It can be defined as the last 24 hours, week-to-date, month-to-date, or other relevant periods, depending on the monitoring requirements.
Threshold: A threshold determines the severity level at which alerts or other actions are triggered. VIANOPS, for example, defines two levels of thresholds: Critical, which signifies severe issues requiring immediate attention, and Warning, which indicates issues that are less critical but still merit attention.
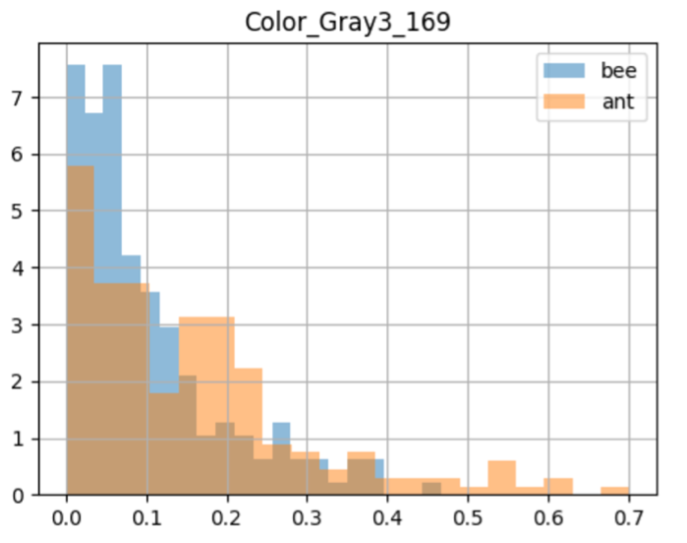
Value distribution: Value distribution refers to the frequency of specific values falling into different bins or value ranges for a feature during the target or baseline window. Tools like VIANOPS allow users to customize how value ranges are grouped for easy interpretation in a business context. By default, VIANOPS groups continuous feature values into 10 bins, while categorical features use the categories as bins.
In our conversations with customers, sometimes the most challenging part is ensuring everyone is on the same page about the goals, challenges and desired outcomes in monitoring models once deployed, especially in highly distributed teams that want to leverage best practices, or when models are handed off from development to production stages. Finding common terminology can help teams drive enhanced collaboration and identify the solutions that ensure the ongoing reliability and accuracy of their predictive models.

Running high-scale model monitoring, or just getting started? VIANOPS can help – we would love to connect.

https://launchpad.vianai.site/signup

You can also go directly to the free trial and get started right away.

https://launchpad.vianai.site/signup

Revolutionizing AI Model Monitoring: VIANOPS and the AI-Driven Enterprise

In today’s rapidly evolving business landscape, enterprises are increasingly turning to AI technologies to enhance their processes, decision-making, and overall productivity. However, deploying and monitoring these AI models in the real world poses significant challenges. Models can falter, perpetuate biases, and introduce ethical concerns, necessitating robust monitoring solutions. Enter VIANOPS – a groundbreaking monitoring platform designed to meet the complex demands of AI-forward enterprises.


Unleashing the Power of High-Scale Monitoring

VIANOPS empowers data scientists and MLOps teams to manage highly complex and feature-rich ML models that drive business operations. Our high-scale monitoring capabilities allow users to confidently analyze complex details that may impact model performance. Whether it’s tens of thousands of predictions per second, hundreds of features and segments, or millions of transactions across multiple time windows, VIANOPS can efficiently identify and solve problems before they degrade model performance.

Not at the level of high-scale monitoring yet? Not a problem. VIANOPS meets data science and ML teams where they are – we provide a platform that is scalable to meet our customers’ needs over time. With VIANOPS, enterprises have a long-term solution that grows with model operations complexity and scale, while always remaining affordable.

Three Critical Assets, One Comprehensive Solution

The platform monitors three critical assets – input data, output data, and ground truth data – to ensure model performance aligns with expectations. By analyzing changes or drifts in these distributions, VIANOPS detects when significant deviations occur. Users can set threshold parameters, and smart alerts are triggered when distributions drift beyond acceptable limits. This allows for proactive investigation, retraining, and deployment of improved models. The platform also offers automation capabilities through APIs and a Python SDK for seamless detection and retraining of models.

Mitigating Risks and Ensuring Fairness

Bias perpetuation and unfair practices are common concerns in AI models. VIANOPS provides robust capabilities, including Root Cause Analysis, to identify patterns and monitor for even the slightest changes in large datasets. By enabling data scientists and ML engineers to take timely mitigation actions, VIANOPS minimizes the risk of model degradation and incorrect outcomes. This ensures fairness and reliability in AI-driven decision-making.

Accessible Scalability at Low Cost

One of VIANOPS’ key differentiators is its ability to monitor complex AI models at scale without requiring expensive infrastructure investments. Enterprises can deploy and monitor the most advanced models, including Large Language Models (LLMs), without exceeding their budgets. This accessibility democratizes AI, making it available to a wide range of enterprises, regardless of their size or resources.

Adapting to AI Model Evolution

The AI landscape is evolving at a breakneck speed, with new model types emerging rapidly. VIANOPS is designed to support a diverse range of models, from traditional tabular data-based models to cutting-edge LLMs, Generative AI models, and computer vision models. By providing dedicated monitoring capabilities for these highly error-prone models, VIANOPS ensures performance, reliability, and ethical usage throughout their lifecycle.

Best-in-Class User Experience

VIANOPS not only excels in its monitoring capabilities but also offers a user experience that sets it apart from other platforms. With a focus on design, the platform invokes trust and confidence in users. It features easily-digestible graphs, intuitive dashboards, and clear language to provide comprehensive insights into model performance. Smart alerts enable rapid involvement and action across teams, fostering collaboration and efficient problem-solving.

Seamless Integration, Enhanced Security

Integration is a critical aspect for enterprises when it comes to monitoring AI models. VIANOPS addresses this by offering seamless integration into various APIs, data sources, MLOps platforms, and collaboration tools. It ensures data security by allowing enterprises to maintain control over their sensitive machine learning data, without compromising on automation and efficiency. VIANOPS adapts to each company’s unique workflow, integrating effortlessly into their existing systems.

Looking Ahead

As companies increasingly rely on complex ML models to drive their core business operations, the need for effective model monitoring becomes paramount. VIANOPS caters to this emerging demand by providing a comprehensive, scalable, and user-friendly platform. With its focus on high-scale monitoring, bias mitigation, low cost, and seamless integration, VIANOPS is at the forefront of revolutionizing AI model monitoring. It empowers enterprises to unlock the true potential of AI while ensuring fairness, reliability, and productivity gains across all organizational roles.

Experience VIANOPS Today

Interested in taking your AI model monitoring to the next level?

Sign up for a free trial of VIANOPS and explore our expansive capabilities, simplicity, and usability. Whether you’re a data scientist, ML engineer, or any ML practitioner, VIANOPS offers a platform tailored to your specific needs. Join the revolution in AI model monitoring and observability and witness firsthand how VIANOPS can transform your business operations.

Or reach out to our team for more information or to discuss how VIANOPS can elevate your ML operations to new heights.

Evolution of ML Monitoring: From Tabular Data to Large Language Models, VIANOPS Keeps Models Running at Peak Performance

Evolution of ML Monitoring: From Tabular Data to Large Language Models, VIANOPS Keeps Models Running at Peak Performance

Artificial Intelligence (AI) and machine learning (ML) have been buzzwords for the past decade, and rightly so. AI/ML models have the power to revolutionize industries by automating decision-making,streamlining processes, and improving productivity. However, as more companies rely on AI/ML models to run their businesses, the need for monitoring these models becomes increasingly important and complex. There’s an important evolution happening around tabular-data-based ML model monitoring as companies try to move from basic models and basic monitoring to high-scale sophisticated models that require a new generation of model monitoring at scale. Adding to this is the now rapidly emerging interest in large language models (LLMs) in the enterprise, and yet no real ability to monitor them given the nature of these models and the known reliability problems and risks that are still yet to be solved even in the consumer context. Effective monitoring now with the stakes so high, becomes more important than ever, which we will explore here.

ML Model Monitoring

Tabular data is the traditional form of data that has been used in ML for many years. This type of data is structured, with rows and columns, and is easily understood by humans. ML models are trained on this type of data and are often used in business applications, such as failure prediction, credit scoring, or fraud detection.

ML model monitoring involves tracking model performance metrics such as accuracy, precision, and recall for classification tasks, to ensure that the model performs  as expected. If the model’s performance deviates from the expected performance metrics, it can be an indicator of input data drift, also known as feature drift, which means that the model is no longer receiving data that is representative of the training data. In this case, the model may need to be retrained on new data.

Many organizations had started monitoring these tabular-data-based models for performance, but many organizations still haven’t had the tools to do this at high scale, to support businesses that are running feature-rich, high-transaction models across multiple clouds and data sources. There are fraud detection models, and then there are high-stakes, high-scale fraud detection models (credit card fraud, insurance fraud, identity theft, and so on) that need to look at infinite performance dimensions in granular detail.

Large Language Model Monitoring

In recent years, and much more rapidly in recent months, large language models (LLMs) have started to emerge and become more prevalent – mostly outside the enterprise context (for now). LLMs are deep learning models that are trained on vast amounts of text data and can generate human-like responses to questions in natural language. These models have revolutionized the field of natural language processing (NLP) and have many practical applications, such as chatbots, language translation, and content generation.

LLM monitoring is more complex than traditional ML model monitoring because LLMs can be used to solve a wide variety of tasks, from answering questions and producing summaries to generating novel text or code. LLMs are trained for a multitude of tasks rather than just one, and often with a very large corpus of text data. As a result, it can be difficult to determine what constitutes “good” or “bad” performance across a wide variety of metrics and tasks. In LLM monitoring, metrics such as perplexity, which measures the model’s ability to predict the next word in a sequence, and diversity, which measures the variety of responses generated by the model, are used to assess performance. In addition, there are specific metrics that are used to assess the performance of the model on answering questions with or without provided context.

Language models embed text inputs into high-dimensional spaces. Each of these dimensions individually  are difficult to interpret or provide meaning to. The embedding spaces of different language models are also different from one another and are impacted by the data the models were trained on, the complexity of text, and training parameters of the models themselves. Therefore, it is challenging to monitor the model’s own internal representation of text and how it connects various concepts together.

LLM monitoring also involves monitoring for bias and ethical considerations. LLMs are often trained on text data from the internet, which can contain biases and offensive language. If these biases and offensive language are not detected and addressed, the model’s responses could reflect these influences and offend or harm users.

Why LLM Monitoring is Crucial for Enterprises

LLM monitoring is crucial for enterprises that want to take advantage of ML models to run their businesses. In the case of chatbots, for example, a poorly performing LLM can lead to frustrated customers and lost business. In the case of content generation, a biased LLM can generate offensive or harmful content, leading to reputational damage and legal consequences.

There are also issues of confidentiality and security around LLMs in the enterprise. For example the security and privacy of data used in an LLM such as data points provided via prompts or uploads (documents, text, code, images etc), and other means, that may be confidential, proprietary, or otherwise restricted.

In addition, and perhaps most importantly, LLM monitoring is crucial for ensuring ethical considerations are met. LLMs have the power to influence people’s opinions and beliefs, and it is the responsibility of the enterprise to ensure that the model’s responses are fair, explainable and unbiased.

The evolution of tabular ML model monitoring to large language model monitoring reflects the increasing importance of monitoring ML models in today’s advanced AI world. As more enterprises rely on ML models to run their businesses, it is crucial to ensure that these models are performing as expected and that ethical considerations are met. LLM monitoring is complex, but it is essential for ensuring the success and reliability of ML models in the enterprise.

ML Monitoring for the High-Performance Enterprise

VIANOPS, our spring release of our ML model monitoring and observability platform, was developed against the backdrop of rapid AI advancements while staying grounded in our company mission at Vianai Systems to bring safe, reliable, human-centered AI systems to enterprises.

If you and your MLOps team would like to test out VIANOPS ML monitoring capabilities, sign up for our limited-time free trial.

Data Drift Monitoring in Demand Forecasting Model

Introduction

If you have been working on training and deploying machine learning models for a while, you know that even if your model is exceptionally well trained and validated, its performance may not hold up to expectations in production. This may be due to the possibility that the data in production could be quite different from the training data of your models. The production data may also keep changing over time, so even models that initially perform well may degrade over time. This is why monitoring data drift in production is arguably more important than training a good model. Indeed, at the end of the day, if a highly complex model is making arbitrary inferences because of data drift, the outcome is worse than a simpler model that has been diligently monitored and updated!

Retail stores often use demand forecasting ML models to predict how much inventory they should procure ahead of time. One may say that retail sales are easy to forecast, as they often follow a strong seasonal pattern. However, anyone with decent experience in the trade knows that demand forecasting is in fact a highly complex problem. As an example, retail sales are prone to the impact of unexpected events; an unexpectedly hot summer could boost the sales of air conditioners, while an unexpectedly warm winter could make the sales of skis plummet. The fact that retailers often need to prepare their inventory well ahead of time means that any predictive power degradation of the model due to data drift could incur significant costs. Therefore, monitoring models diligently and taking timely and appropriate actions when data drifts, is the key to success in forecasting demand.

In this article, we will walk through an example to see how the most impactful event in recent history – the COVID pandemic – can impact a retail chain with three stores in three different cities. We will discuss challenges when monitoring demand forecasting models, and then show how the flexible suite of tools VIANOPS provides can greatly empower data scientists and machine learning engineers to address these challenges.

An overview of the example

In this example, a fictional retail chain owns three stores located in Boston, San Antonio and Miami. The COVID pandemic unexpectedly and significantly impacted the business. However, for reasons such as the prevalence of the virus, temperature, etc., the impact at each store was different: the sales at the Boston store plummeted, the sales at the San Antonio store skyrocketed, while Miami was largely unimpacted. The figure below shows the actual sales at each store, as well as a hypothetical sales trend (shown in orange in the charts below), which assumes the COVID pandemic never happened.


Extracting metrics from an image. Metrics are more interpretable than embeddings from a neural network.
drift monitoring example of sales during COVID

How VIANOPS handles challenges in monitoring retail sales data

There are many challenges when monitoring retail sales data and features. We are going to focus on two of them in this article.

The necessity to monitor data drift by segments

In our example, segmentation simply means monitoring data drift of different stores individually, instead of merging together the data of all stores. This is because sales from different stores have different magnitudes and patterns. In more complex cases, segmentation could mean categories of SKUs by different stores, new versus old SKUs, etc. The number of segments could grow quickly and exponentially, and having the flexibility to create segments, and the capability to easily manage them in one place, is essential to the monitoring job.

VIANOPS allows users to create segments using their own definitions that fit their business needs and monitor drifts in inference data and model performance by segments. The figure below shows an example API call where we define segments using the model feature “store” to create one segment for each store; the created segments will then appear in the VIANOPS user interface. The segments are also easy to manage, as all of them are under one model.


(Left) Users can define their own definitions of segments, using the flexible API VIANOPS provides. (Right) The segments created using the API call will then appear in the VIANOPS user interface.
drift monitoring by segments

The necessity to monitor data drift from different angles and granularities

Drift in retail sales data happens all the time, as it often follows a strong seasonal pattern. For example, sales may drift up during the holiday season. However, unless the drift  (statistical distance between data points) is truly abnormal, often we do not need to take actions on such drifts, as our models should have been well trained, and should have seen similar drifts in past holiday seasons, and hence have the capability to produce reasonably accurate predictions.

Therefore, only comparing sales with recent history may not reveal that the current drift caused by COVID is abnormal in nature – see the figure below. In this case, a more appropriate way to monitor drift is by comparing recent sales with sales of the same period last year. The figure below shows that the sales in April 2020 are clearly at an elevated level when compared to the same period in 2019 and calculating metrics such as Population Stability Index (PSI) on these two periods will surely reveal the abnormal nature of the current drift.

VIANOPS allows users to define their own time-based, monitoring schedule, or policies. This includes the capability to freely define the target and baseline windows when calculating drift. In this example, we created two monitoring policies in VIANOPS, to visualize the importance of monitoring data drift from different angles.


(Top) Only comparing sales with its recent history may not reveal that the current drift caused by Covid is abnormal in nature. (Bottom) A more appropriate way to monitor drift is by comparing recent sales with sales of the same period last year.
drift monitoring comparing sales

The first policy is a week-over-week policy, where we compare the values of feature sales_7d (a 7-day lagged feature of the actual sales) of the current week, versus the feature values in the previous week, and calculate the PSI. We run this policy over a one-year period. As you can see in the figure below, although the PSI could be high from time to time, it never persists to indicate any suspicious trend. If we only monitor the models in this way, the abnormal data drift caused by the Covid pandemic may not be detected, and no decision will be made or consider retraining to update the model! This could cause significant financial harm.


Population Stability Index (PSI) of a week-over-week policy on feature sales_7d (a 7-day lagged feature of the actual sales), over a one-year period. Although the PSI could be high from time to time, it never persists to indicate any suspicious trend.
drift monitoring week-over-week policy

We then create a second policy, which compares the feature values of the current month versus those in the same month last year and calculates the PSI. In the figure below, one would immediately notice that the PSI is at a persistently elevated level for Boston and San Antonio since the Covid pandemic started, while the one for Miami is largely flat. Additionally, the PSI for the data for all stores (indicated as All Data) also does not show any unusual trend. This is consistent with our original assumption, where the sales at Boston and San Antonio are significantly impacted by the Covid pandemic, while its impact on Miami is minimal. By seeing this, a data scientist would immediately make the decision to update the demand forecasting models for Boston and San Antonio, while keeping the model for Miami unchanged for now. They would have missed all of this if they had either not been monitoring or monitoring just the entire data set (instead of monitoring at the individual store level), or monitoring at smaller time scales (e.g., week over week).


Population Stability Index (PSI) of a policy that compares the values of feature sales_7d of the current month, versus those in the same month last year. The PSI is at a persistently elevated level for Boston and San Antonio since the Covid pandemic, while the one for Miami is largely flat.
drift monitoring comparing values


As you can see in this example, it is essential to monitor data drift from various angles, at different granularities and segments, to not only detect drifts, but also pinpoint where the drifts happened so that we can take the right course of action. Without a complete and flexible suite of monitoring tools, there would be no way to do a root cause analysis when your models degrade in front of your eyes!

Conclusion

Data drift could sabotage the hard work you put into training a machine learning model, but more importantly, may cause significant financial harm. This not only applies to demand forecasting, but to any modeling use case. VIANOPS provides data scientists and machine learning engineers with a suite of highly flexible tools they will need to define and execute drift monitoring in real-time of both structured and unstructured data in their own unique business setting. At the end of the day, letting drift fly under the radar is the last thing you want to do.


We’ve now made VIANOPS available free, for anyone to try. Try it out and let us know your feedback.

Monitoring Data Drift in Image Data

Introduction

If you have been working on training and deploying Machine Learning models for a while, you know that even if your model is exceptionally well-trained and validated, performance of the model may not hold up to expectation in production.

This is due to the possibility that the inference input data in the model in production could be quite different from the training data of your models. The inference data distribution may also keep changing, so even models that initially perform well may degrade over time, and drift occurs. This is why monitoring data drift in production is arguably more important than initially training a good model.

Indeed, at the end of the day, if a highly complex model makes arbitrary inferences  as a result of inference data drift, the outcome is worse than a simpler model that has been diligently monitored and updated!

For structured data, popular metrics to monitor data drift include Population Stability Index (PSI) and Jensen-Shannon Divergence. On the other hand, drifts in unstructured data, such as imagesimage and text, are perceived to be more complex to measure. However, by leveraging a wide range of algorithms available to transform unstructured data into structured data, measuring drifts in unstructured data is, in fact no more complex than its structured counterpart.

In this article, we will walk through an example ofon detecting and pinpointing drift in image data using VIANOPS.


Example bee images. Our hypothetical model is trained on bee images.
no img no img no img
Example ant images. We simulate an incident when the inference data suddenly shift to ant images
no img no img no img

An overview of the example

The underlying data of this example is publicly available at the PyTorch Tutorial. We hypothesize that we have trained a model on bee images only and is used to classify (future) bee images. We will simulate an incident where the inference data “accidentally” switched to ant images at one point.

We will walk through how the inference data’s drift was detected in the first place, and subsequently when the drift likely happened by examining the inference data at a more granular level, all leveraging the highly flexible monitoring capability VIANOPS provides. 

Transforming image data into structured data

To monitor drift in unstructured image data, we first need to transform the data into structured data. In general, there are two ways to do such a transformation. One way is extracting embeddings from a neural network, such as a pre-trained network (ResNet for example). This approach is especially convenient if the model you build to classify images is already a neural network model – in this case, you will just need to extract the values from the layer before the output layer. The disadvantage of this approach is its poor interpretability – while neural networks could be highly successful in making accurate predictions, it is not easy, if not impossible, to tell what the value on each neuron truly represents.

In this example, we adopt a different approach – extracting metrics from the images. For example, metrics features include saturation and gray scale of the images. They are much more explainable than embeddings extracted from neural networks, and drifts in them are therefore more likely to give users a hint on what may have changed in the infere

Extracting metrics from an image. Metrics are more interpretable than embeddings from a neural network..
no img

As an example of how metrics are different between bees and ants, the following figure shows the distribution of the feature Color_Gray3_169 of bees and ants. Notice that for ants, the values of this feature are biased towards the right-hand side, compared to those of bees.


The distribution of feature Color_Gray3_169 of bees and ants. Note that for ants, the values of this feature are biased towards the right-hand side, compared to those of bees.
no img

Uploading inference data to VIANOPS over API

Once we set up the monitoring in VIANOPS, we can start sending inference data to VIANOPS for ongoing monitoring. In this example, we simulate a scenario where 204 bee images were processed by a model from March 5 to March 28, and 192 ant images from March 28 to April 4. The goal is to use VIANOPS to first identify any drift in the inference data; if so, try to also pinpoint the drift may have started to happen – like the exact steps a data scientist would follow in practice.

Screenshot of the VIANOPS UI showing the time and amount of inference data processed.
no img

Data Drift in color gray features detected in a week-over-week policy

VIANOPS allows users to create their own monitoring schema, or policies, in a highly flexible way. After uploading the inference data, we first create and run an ad-hoc policy that measures week-over-week drift in the inference data. Specifically, the policy tracks the PSI of eight color gray features by comparing their values of the current week, vs the ones in the prior week. We notice an overall warning-level drift, and the drifts of two features exceed the critical level. This is because looking back from today (April 4, 2023), all inference data this week are ant images, whereas the inference data in the prior week is a mix of both ant and bee images.
 

Screenshots of the VIANOPS UI showing the week-over-week drift, measured by Population Stability Index, in eight color gray features. It shows an overall warning-level drift (top), and drifts in two of eight color gray features exceed the critical value (bottom).
no img

Running a day-over-day policy reveals the potential incident date

As part of the root cause analysis, we are certainly interested in when the inference data may have changed. To do that, we create a day-over-day policy, that measures drifts in these eight color gray features by comparing the inference data of a given date vs the day before. We then run this policy over the last 20 days.

Two observations from running the day-over-day drift policy:

    1. First, the overall day-over-day drift is at a significantly lower level starting from March 28. Here, lower does not mean better; it indicates that the nature of the images started to change on that date. Of course, we know that it is because on that date we started sending ant images to the classifier, instead of bees.
    2. We can further confirm the change by looking at the day-over-day drift in specific features. The figure below shows two examples, Color_Gray7_173 and Color_Gray0_166. Both of them have lower day-over-day drifts starting from March 28.

Both point to the fact that something in the inference data changed on March 28. Next step in practice would be pulling samples of the inference data for that date, to further investigate the root cause.

As you can see, insights VIANOPS provide can significantly accelerate the pace of root cause analysis and detect data drift quickly. Users can also easily set a schedule for the policy to run periodically, such as daily, and get alerts on suspicious data drift in timely manner.


Overall day-over-day drift in eight color gray features is at a significantly lower level from March 28.
no img


Day-over-day drifts in Color_Gray7_173 and Color_Gray0_166 are lower since March 28.
no img

Conclusion

Once we transform the unstructured image or text data into structured data, its drift monitoring is no different from its structured counterpart. Drift in inference data could sabotage the hard work you put into training the machine learning model, but more importantly, may cause significant financial harm. VIANOPS provides data scientists and machine learning engineers a suite of highly flexible tools they need, to define and execute drift monitoring of both structured and unstructured data in their own unique business setting. At the end of the day, letting drift fly under your radar is the last thing you want to see and retraining the model is necessary.
 

We’ve now made VIANOPS available free, for anyone to try. Try it out and let us know your feedback.