Introduction
If you have been working on training and deploying Machine Learning models for a while, you know that even if your model is exceptionally well-trained and validated, performance of the model may not hold up to expectation in production.
This is due to the possibility that the inference input data in the model in production could be quite different from the training data of your models. The inference data distribution may also keep changing, so even models that initially perform well may degrade over time, and drift occurs. This is why monitoring data drift in production is arguably more important than initially training a good model.
Indeed, at the end of the day, if a highly complex model makes arbitrary inferences as a result of inference data drift, the outcome is worse than a simpler model that has been diligently monitored and updated!
For structured data, popular metrics to monitor data drift include Population Stability Index (PSI) and Jensen-Shannon Divergence. On the other hand, drifts in unstructured data, such as imagesimage and text, are perceived to be more complex to measure. However, by leveraging a wide range of algorithms available to transform unstructured data into structured data, measuring drifts in unstructured data is, in fact no more complex than its structured counterpart.
In this article, we will walk through an example ofon detecting and pinpointing drift in image data using VIANOPS.
 |
 |
 |
 |
 |
 |
An overview of the example
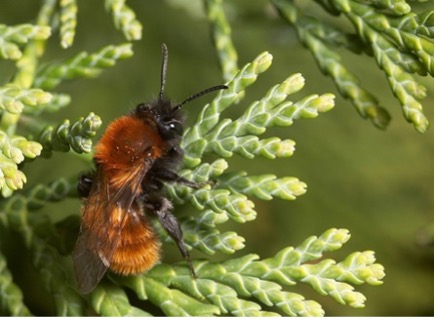
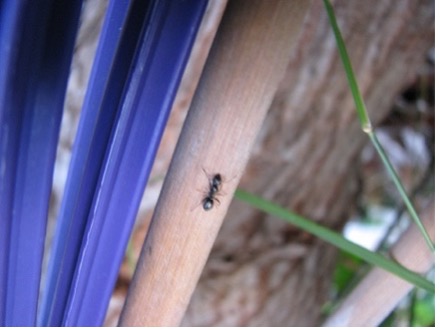
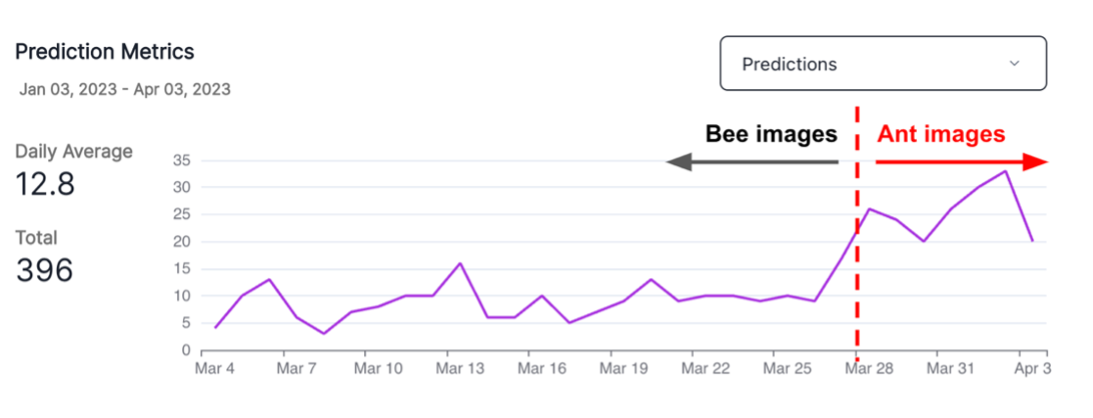
The underlying data of this example is publicly available at the PyTorch Tutorial. We hypothesize that we have trained a model on bee images only and is used to classify (future) bee images. We will simulate an incident where the inference data “accidentally” switched to ant images at one point.
We will walk through how the inference data’s drift was detected in the first place, and subsequently when the drift likely happened by examining the inference data at a more granular level, all leveraging the highly flexible monitoring capability VIANOPS provides.
Transforming image data into structured data
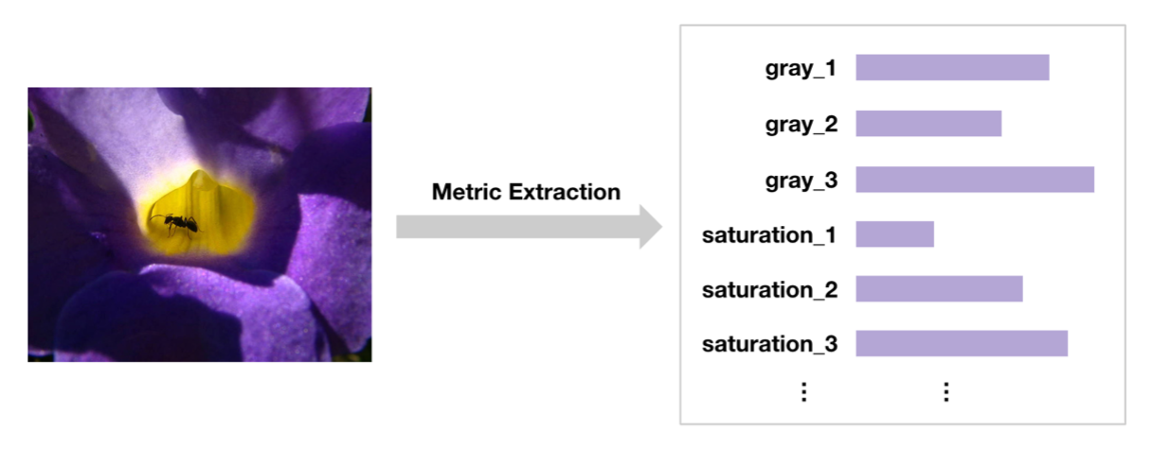
In this example, we adopt a different approach – extracting metrics from the images. For example, metrics features include saturation and gray scale of the images. They are much more explainable than embeddings extracted from neural networks, and drifts in them are therefore more likely to give users a hint on what may have changed in the infere
 |
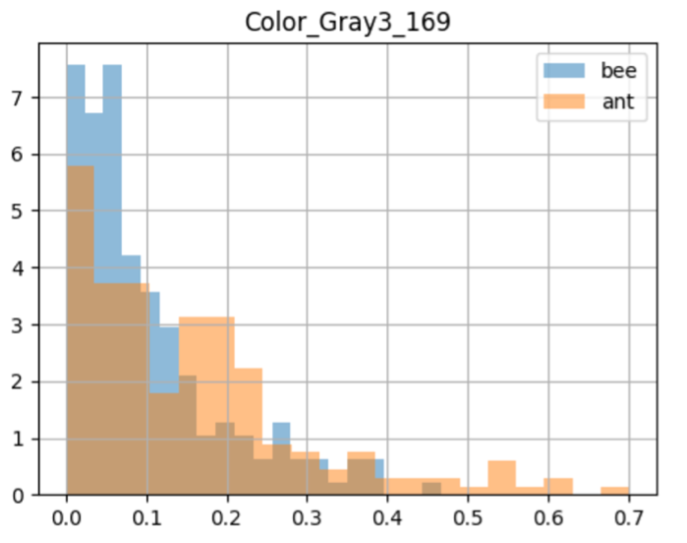
As an example of how metrics are different between bees and ants, the following figure shows the distribution of the feature Color_Gray3_169 of bees and ants. Notice that for ants, the values of this feature are biased towards the right-hand side, compared to those of bees.
 |
Uploading inference data to VIANOPS over API
Once we set up the monitoring in VIANOPS, we can start sending inference data to VIANOPS for ongoing monitoring. In this example, we simulate a scenario where 204 bee images were processed by a model from March 5 to March 28, and 192 ant images from March 28 to April 4. The goal is to use VIANOPS to first identify any drift in the inference data; if so, try to also pinpoint the drift may have started to happen – like the exact steps a data scientist would follow in practice.
 |
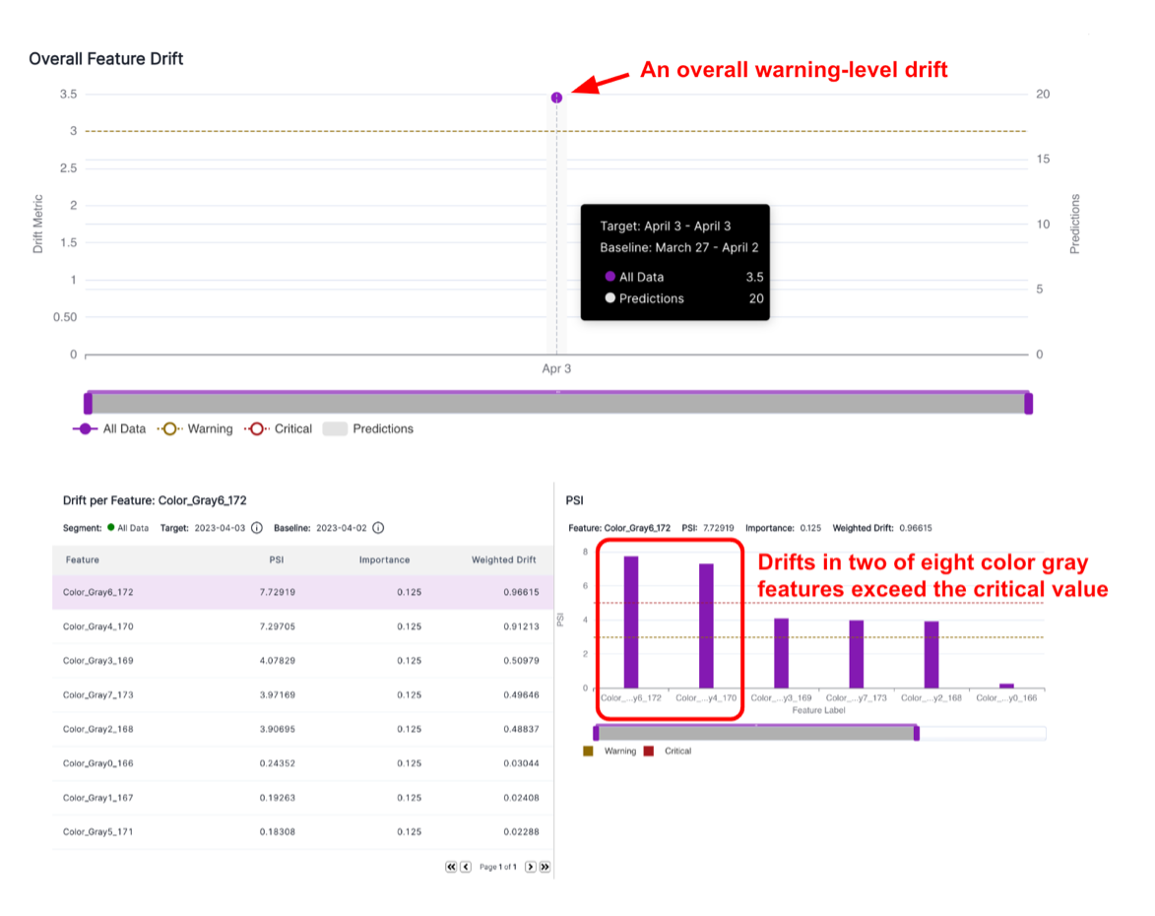
Data Drift in color gray features detected in a week-over-week policy
 |
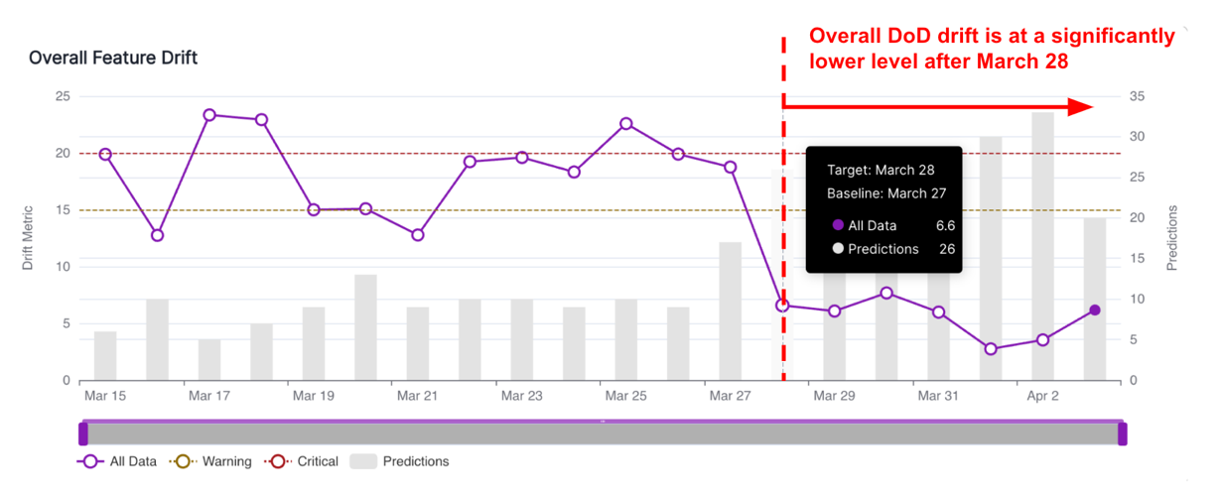
Running a day-over-day policy reveals the potential incident date
Two observations from running the day-over-day drift policy:
-
- First, the overall day-over-day drift is at a significantly lower level starting from March 28. Here, lower does not mean better; it indicates that the nature of the images started to change on that date. Of course, we know that it is because on that date we started sending ant images to the classifier, instead of bees.
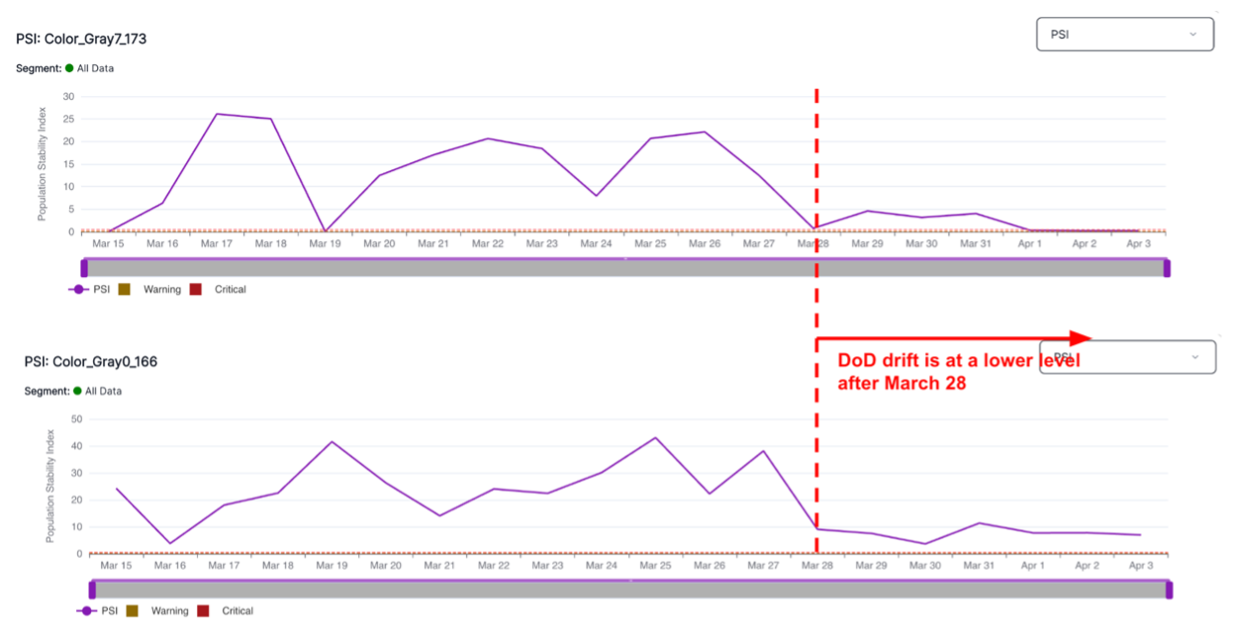
- We can further confirm the change by looking at the day-over-day drift in specific features. The figure below shows two examples, Color_Gray7_173 and Color_Gray0_166. Both of them have lower day-over-day drifts starting from March 28.
Both point to the fact that something in the inference data changed on March 28. Next step in practice would be pulling samples of the inference data for that date, to further investigate the root cause.
As you can see, insights VIANOPS provide can significantly accelerate the pace of root cause analysis and detect data drift quickly. Users can also easily set a schedule for the policy to run periodically, such as daily, and get alerts on suspicious data drift in timely manner.
 |
 |