Introduction
If you have been working on training and deploying machine learning models for a while, you know that even if your model is exceptionally well trained and validated, its performance may not hold up to expectations in production. This may be due to the possibility that the data in production could be quite different from the training data of your models. The production data may also keep changing over time, so even models that initially perform well may degrade over time. This is why monitoring data drift in production is arguably more important than training a good model. Indeed, at the end of the day, if a highly complex model is making arbitrary inferences because of data drift, the outcome is worse than a simpler model that has been diligently monitored and updated!
Retail stores often use demand forecasting ML models to predict how much inventory they should procure ahead of time. One may say that retail sales are easy to forecast, as they often follow a strong seasonal pattern. However, anyone with decent experience in the trade knows that demand forecasting is in fact a highly complex problem. As an example, retail sales are prone to the impact of unexpected events; an unexpectedly hot summer could boost the sales of air conditioners, while an unexpectedly warm winter could make the sales of skis plummet. The fact that retailers often need to prepare their inventory well ahead of time means that any predictive power degradation of the model due to data drift could incur significant costs. Therefore, monitoring models diligently and taking timely and appropriate actions when data drifts, is the key to success in forecasting demand.
In this article, we will walk through an example to see how the most impactful event in recent history – the COVID pandemic – can impact a retail chain with three stores in three different cities. We will discuss challenges when monitoring demand forecasting models, and then show how the flexible suite of tools VIANOPS provides can greatly empower data scientists and machine learning engineers to address these challenges.
An overview of the example
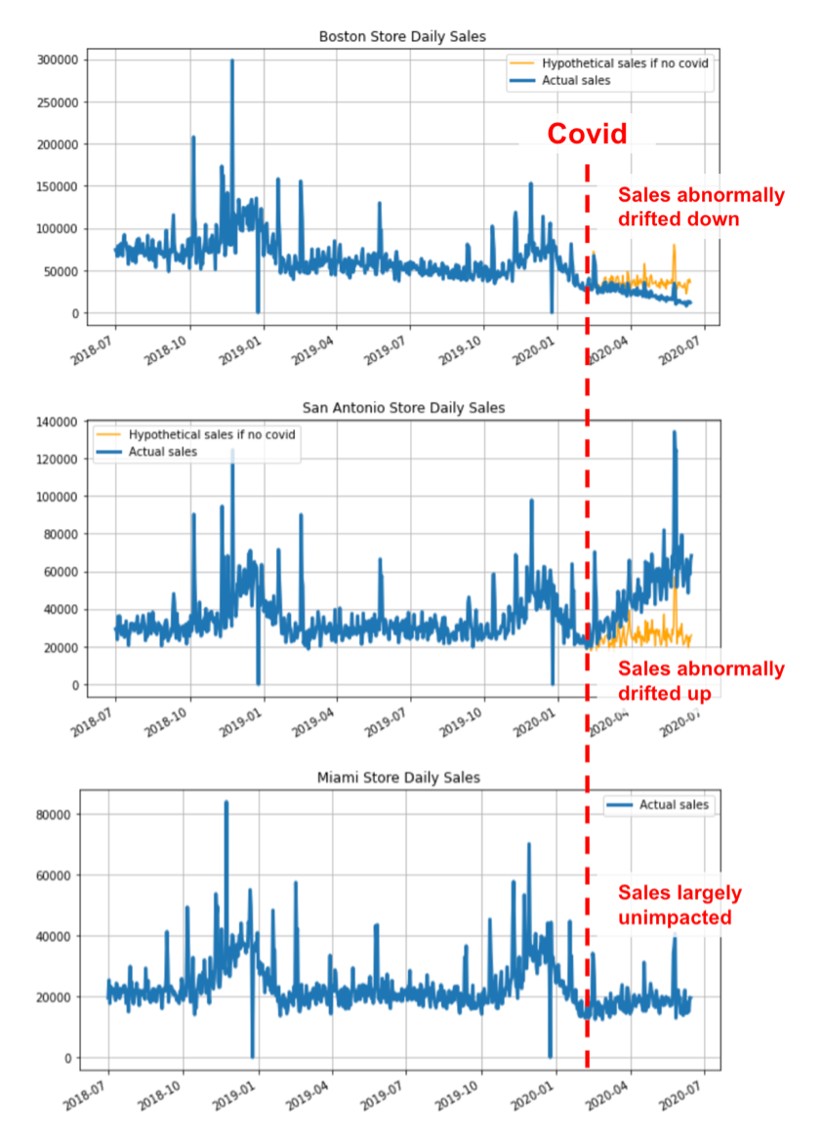
In this example, a fictional retail chain owns three stores located in Boston, San Antonio and Miami. The COVID pandemic unexpectedly and significantly impacted the business. However, for reasons such as the prevalence of the virus, temperature, etc., the impact at each store was different: the sales at the Boston store plummeted, the sales at the San Antonio store skyrocketed, while Miami was largely unimpacted. The figure below shows the actual sales at each store, as well as a hypothetical sales trend (shown in orange in the charts below), which assumes the COVID pandemic never happened.
 |
How VIANOPS handles challenges in monitoring retail sales data
There are many challenges when monitoring retail sales data and features. We are going to focus on two of them in this article.
The necessity to monitor data drift by segments
In our example, segmentation simply means monitoring data drift of different stores individually, instead of merging together the data of all stores. This is because sales from different stores have different magnitudes and patterns. In more complex cases, segmentation could mean categories of SKUs by different stores, new versus old SKUs, etc. The number of segments could grow quickly and exponentially, and having the flexibility to create segments, and the capability to easily manage them in one place, is essential to the monitoring job.
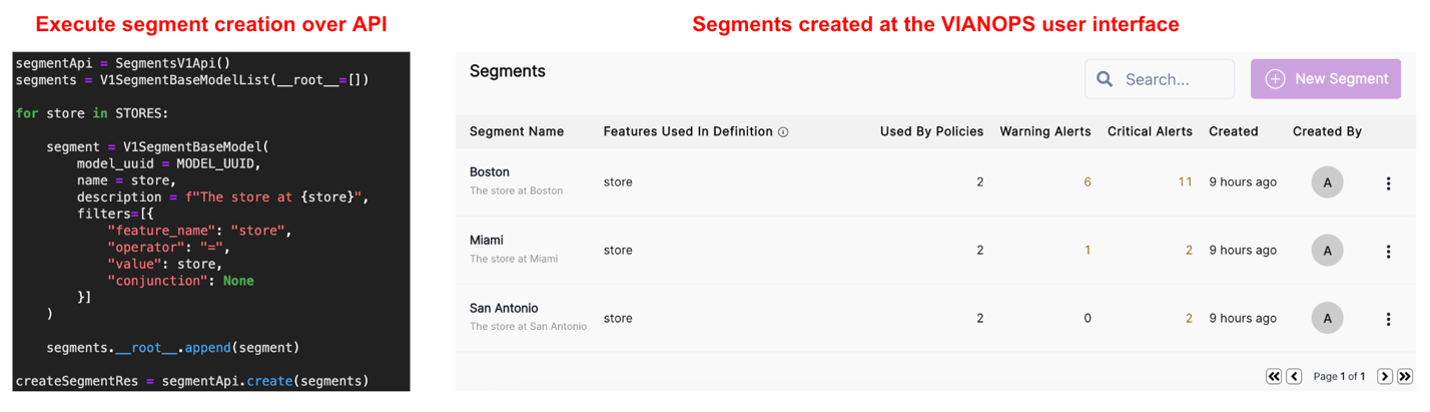
VIANOPS allows users to create segments using their own definitions that fit their business needs and monitor drifts in inference data and model performance by segments. The figure below shows an example API call where we define segments using the model feature “store” to create one segment for each store; the created segments will then appear in the VIANOPS user interface. The segments are also easy to manage, as all of them are under one model.
 |
The necessity to monitor data drift from different angles and granularities
Drift in retail sales data happens all the time, as it often follows a strong seasonal pattern. For example, sales may drift up during the holiday season. However, unless the drift (statistical distance between data points) is truly abnormal, often we do not need to take actions on such drifts, as our models should have been well trained, and should have seen similar drifts in past holiday seasons, and hence have the capability to produce reasonably accurate predictions.
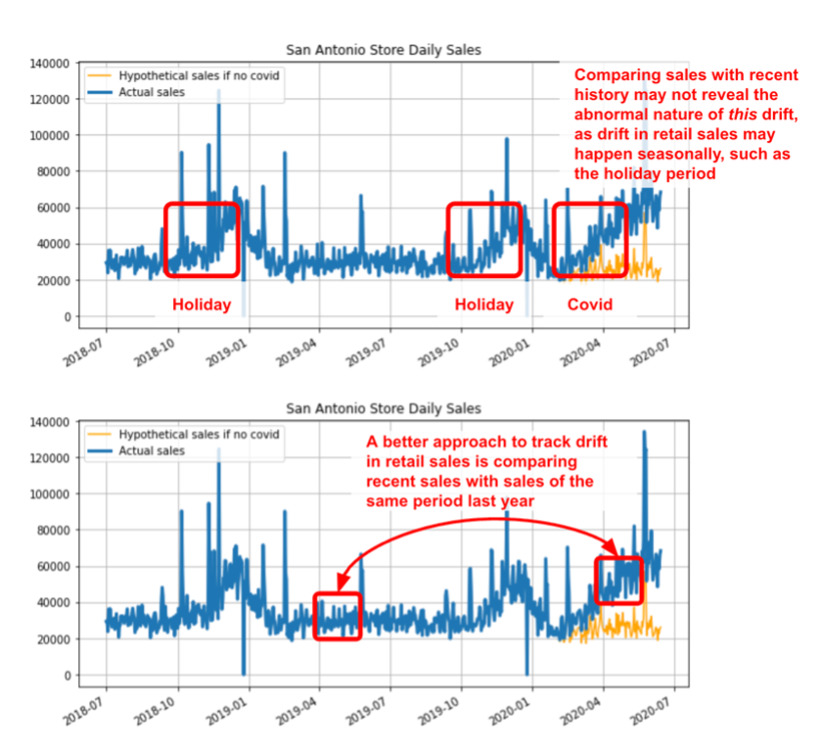
Therefore, only comparing sales with recent history may not reveal that the current drift caused by COVID is abnormal in nature – see the figure below. In this case, a more appropriate way to monitor drift is by comparing recent sales with sales of the same period last year. The figure below shows that the sales in April 2020 are clearly at an elevated level when compared to the same period in 2019 and calculating metrics such as Population Stability Index (PSI) on these two periods will surely reveal the abnormal nature of the current drift.
VIANOPS allows users to define their own time-based, monitoring schedule, or policies. This includes the capability to freely define the target and baseline windows when calculating drift. In this example, we created two monitoring policies in VIANOPS, to visualize the importance of monitoring data drift from different angles.
 |
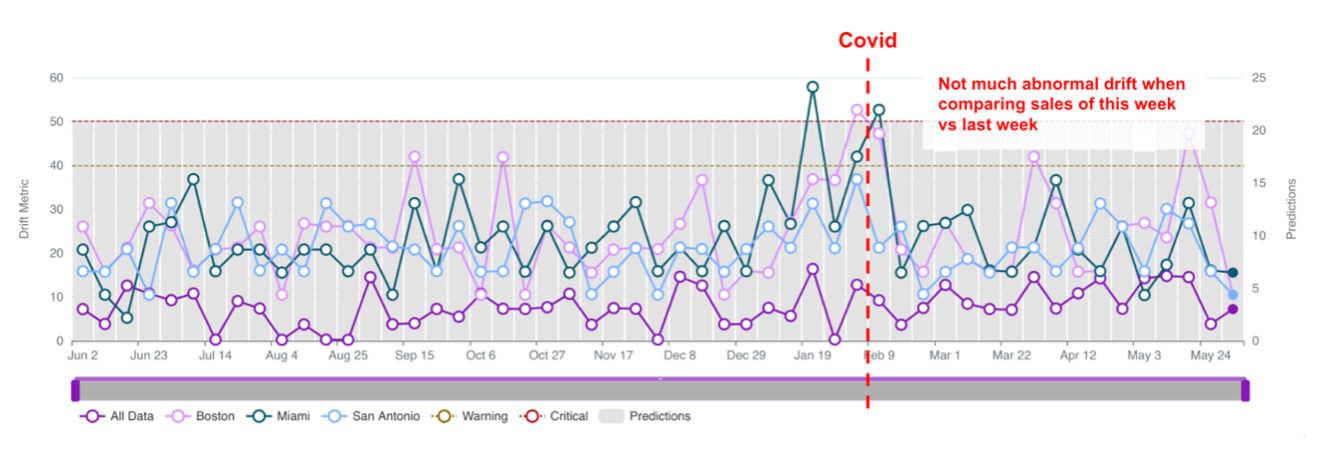
The first policy is a week-over-week policy, where we compare the values of feature sales_7d (a 7-day lagged feature of the actual sales) of the current week, versus the feature values in the previous week, and calculate the PSI. We run this policy over a one-year period. As you can see in the figure below, although the PSI could be high from time to time, it never persists to indicate any suspicious trend. If we only monitor the models in this way, the abnormal data drift caused by the Covid pandemic may not be detected, and no decision will be made or consider retraining to update the model! This could cause significant financial harm.
 |
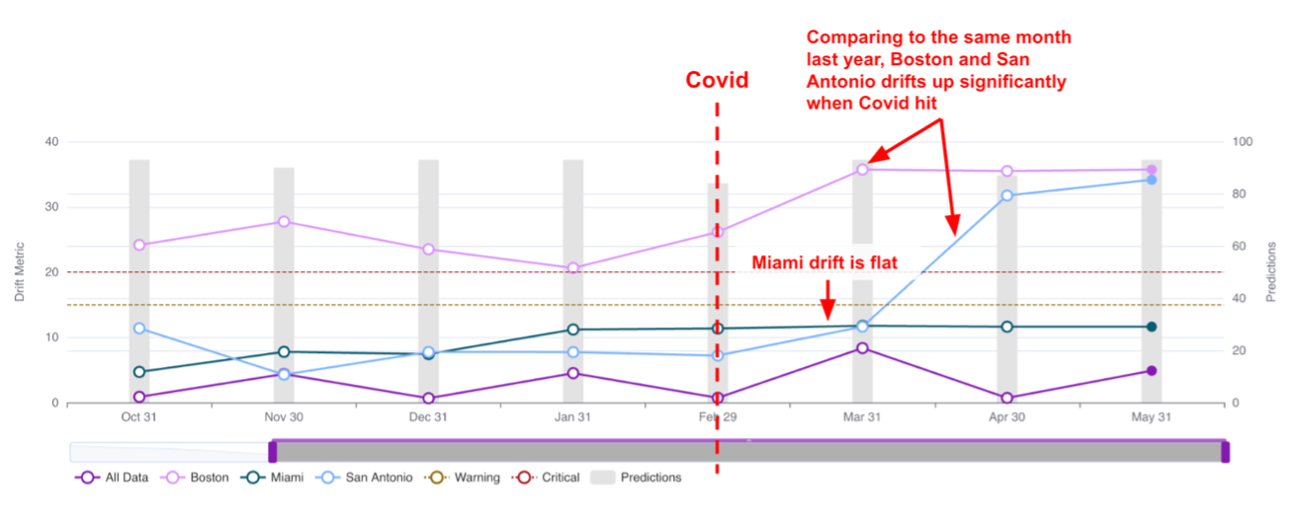
We then create a second policy, which compares the feature values of the current month versus those in the same month last year and calculates the PSI. In the figure below, one would immediately notice that the PSI is at a persistently elevated level for Boston and San Antonio since the Covid pandemic started, while the one for Miami is largely flat. Additionally, the PSI for the data for all stores (indicated as All Data) also does not show any unusual trend. This is consistent with our original assumption, where the sales at Boston and San Antonio are significantly impacted by the Covid pandemic, while its impact on Miami is minimal. By seeing this, a data scientist would immediately make the decision to update the demand forecasting models for Boston and San Antonio, while keeping the model for Miami unchanged for now. They would have missed all of this if they had either not been monitoring or monitoring just the entire data set (instead of monitoring at the individual store level), or monitoring at smaller time scales (e.g., week over week).
 |
As you can see in this example, it is essential to monitor data drift from various angles, at different granularities and segments, to not only detect drifts, but also pinpoint where the drifts happened so that we can take the right course of action. Without a complete and flexible suite of monitoring tools, there would be no way to do a root cause analysis when your models degrade in front of your eyes!
Conclusion
Data drift could sabotage the hard work you put into training a machine learning model, but more importantly, may cause significant financial harm. This not only applies to demand forecasting, but to any modeling use case. VIANOPS provides data scientists and machine learning engineers with a suite of highly flexible tools they will need to define and execute drift monitoring in real-time of both structured and unstructured data in their own unique business setting. At the end of the day, letting drift fly under the radar is the last thing you want to do.