A Comprehensive Machine Learning Operations Solution for Monitoring Drift in Credit Card Fraud Detection
Abstract
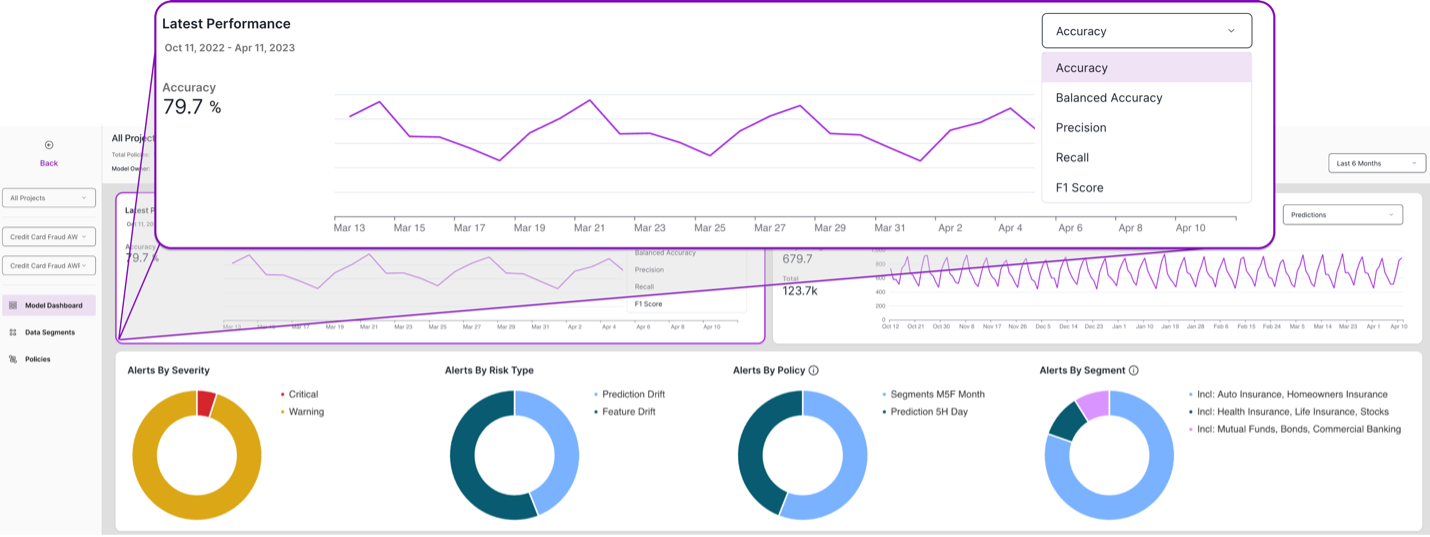
In this paper, we describe a model agnostic, monitoring solution called VIANOPS that allows data scientists to monitor drift in credit card fraud detection models. Our approach accommodates inferences from any classification model, allowing users to develop and deploy models with their preferred tools. By employing data-driven techniques such as Jensen-Shannon divergence and Population Stability Index (PSI), we provide a granular understanding of data (feature drift), prediction drift, and model performance metrics. VIANOPS also features a model dashboard that displays an overview of model performance, prediction volumes, and drift alerts. This enables users to analyze specific data segments and identify root causes of drift at different points in time, offering flexibility and adaptability to various use cases.
Introduction
Credit card fraud detection is a critical task, requiring robust and adaptable machine learning models to effectively identify fraudulent transactions. The ground truth of a credit card model may also be delayed because the time needed to investigate a potential fraud may take days to months. So, to maintain high performance, monitoring drifts in input data and model predictions is essential. In this paper, we present a comprehensive monitoring solution capable of detecting drift in credit card fraud transactions across various granular segments, prediction drift, as well as tracking key model performance metrics for a classification model. Our solution also includes a dashboard that provides an overview of model performance (when ground truth is available) and drift alerts, ensuring users are informed of any abnormalities or issues.
Data Description
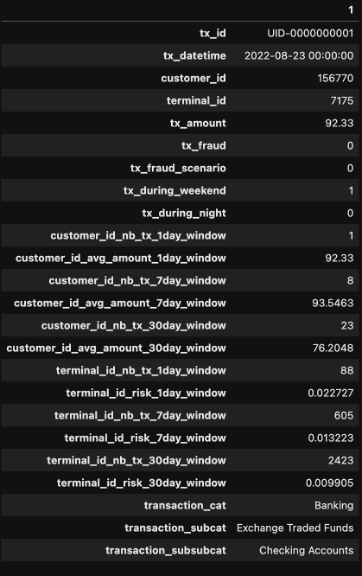
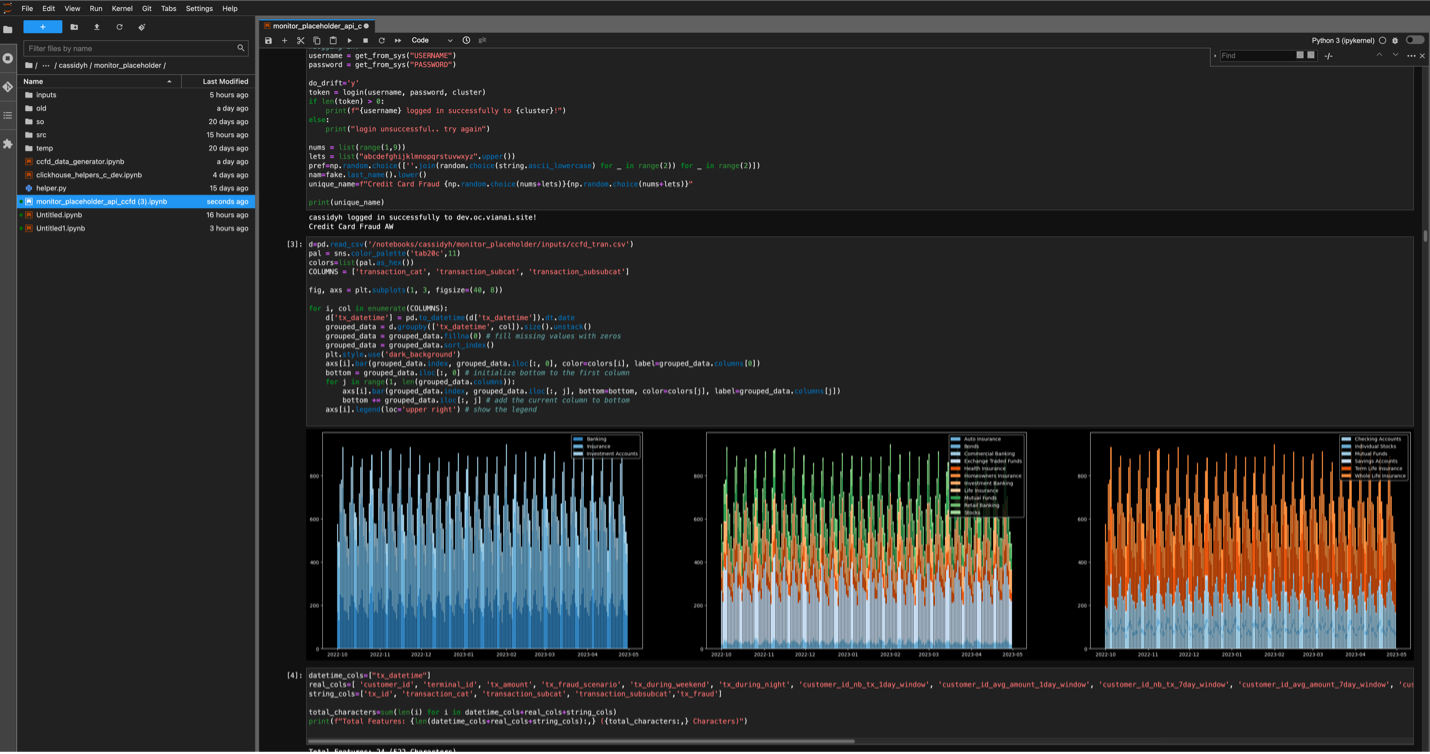
The dataset used in this solution is tabular and structured, including transaction ID, date-time, customer, terminal ID, transaction amount, fraud indicators, transaction categories, subcategories, sub-subcategories, and various engineered features that could indicate fraud (e.g., number and average amount of transactions within specific time windows, etc.). The dataset covers various transaction types, including banking, investment accounts, insurance, and their corresponding subcategories and sub-subcategories.
Drift Monitoring and Measurement
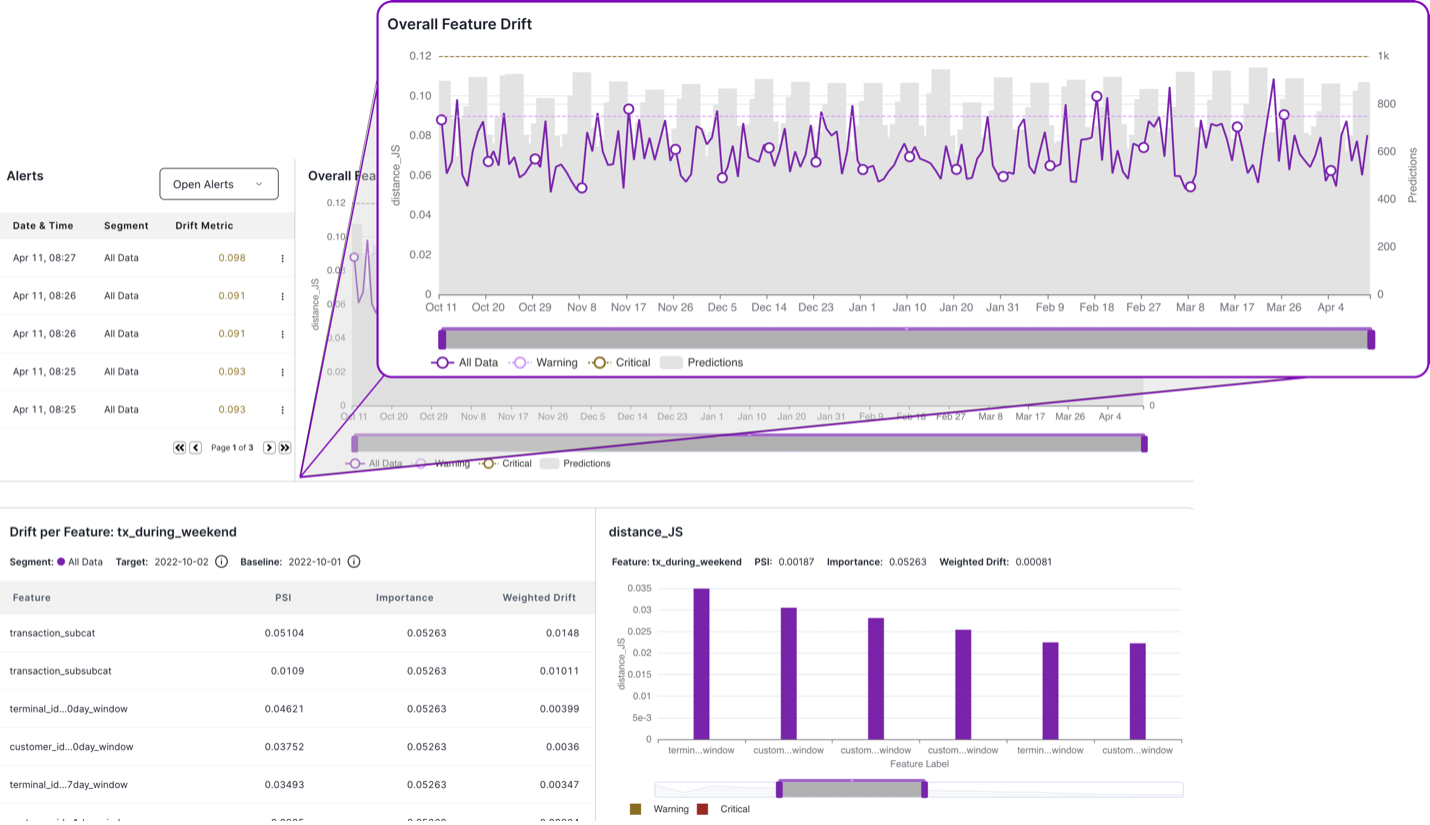
VIANOPS utilizes the Jensen-Shannon divergence and Population Stability Index (PSI) to effectively quantify and measure drift in data and features. By analyzing histograms and distributions of target and baseline data at different granular levels, we can identify root causes of drift at specific points in time. This provides users with a comprehensive understanding of drift behavior, enabling us to detect and mitigate drift occurrences more effectively.
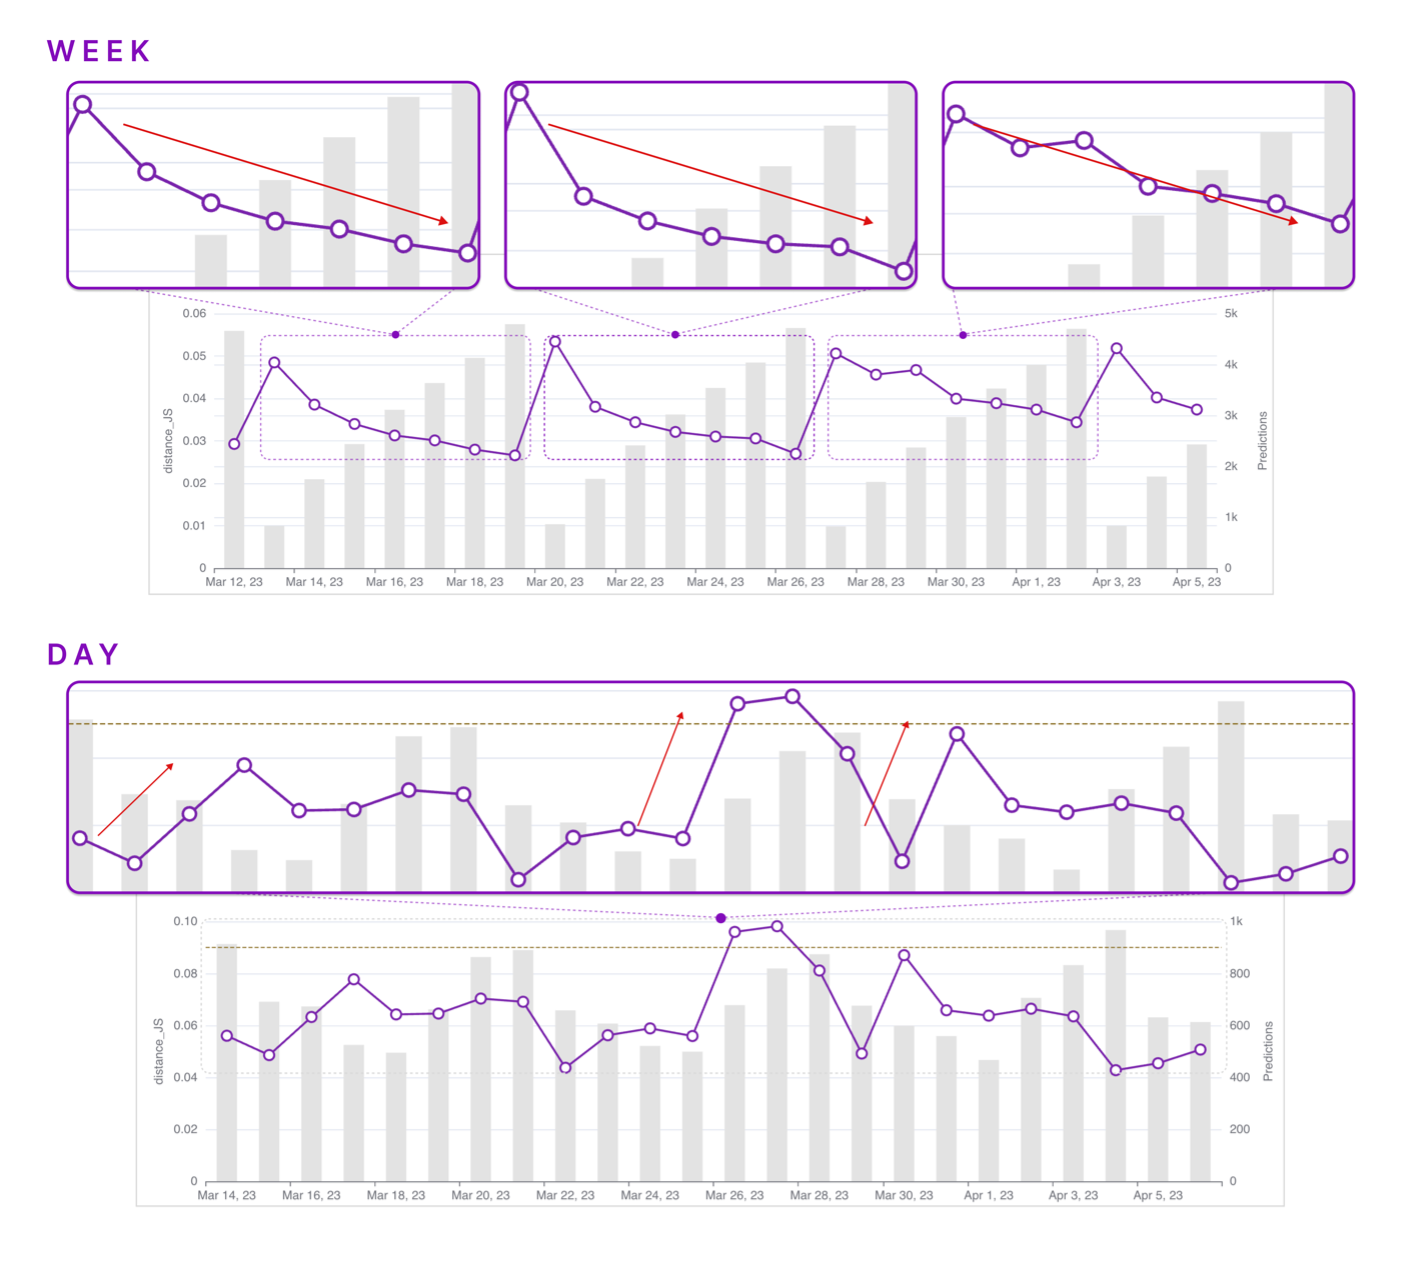
One of the key strengths of VIANOPS is its ability to support day-over-day, weekday-to-weekdays, week-over-week, month-over-month, and quarter-over-quarter analysis. This facilitates the necessary flexibility to analyze drift behavior over different time frames, allowing us to gain insights into the underlying patterns and trends that are driving the drift. This flexibility is particularly important in the context of credit card fraud detection, where fraudulent activity patterns can evolve and change rapidly, therefore monitoring in real time is critical.
In addition, we provide the ability to configure policies that compare and monitor different time frames. This allows our solution to adapt to different scenarios and provide insights that are tailored to the specific needs of the organization. An unknown author once said, “Flexibility comes from having multiple choices; wisdom comes from having multiple perspectives.” Our solution embodies this philosophy by providing multiple perspectives on drift behavior and the ability to configure policies that reflect the unique needs of the organization.
The flexibility to analyze different time frames is particularly important when monitoring for drift. While one-timeone time configuration may show low level or slow/moderate increases in drift, another configuration may show drastic and untimely drift occurrences. By providing the flexibility to compare and monitor different time frames, our solution can identify and respond to drift more effectively, minimizing the risk of fraudulent transactions slipping through undetected, and thus leading to significant financial losses.
Drift Monitoring and Segmentation
To support further root cause analysis, VIANOPS also offers advanced data segmentation capabilities, enabling users to monitor drift across specific segments based on filters and compare them to the overall model drift or with other segments within the same model. By incorporating segment-based drift analysis into monitoring for prediction, feature, and performance drift, users can tailor their monitoring strategies to focus on specific areas of interest or concern within the model. This added granularity allows for more effective model maintenance, ensuring that the deployed models remain accurate and robust in various parts of the data.
Detailed Analysis of Segmentation over a Six-Month Time Frame
The segmentation capabilities provide invaluable insights by allowing users to identify drift patterns specific to various segments within the data. In this section, we will explore a detailed example of segmentation analysis over a six-month period, focusing on a day-over-day policy.
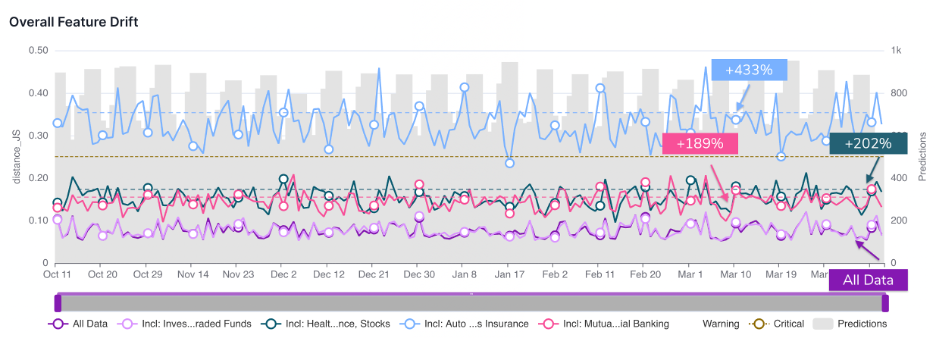
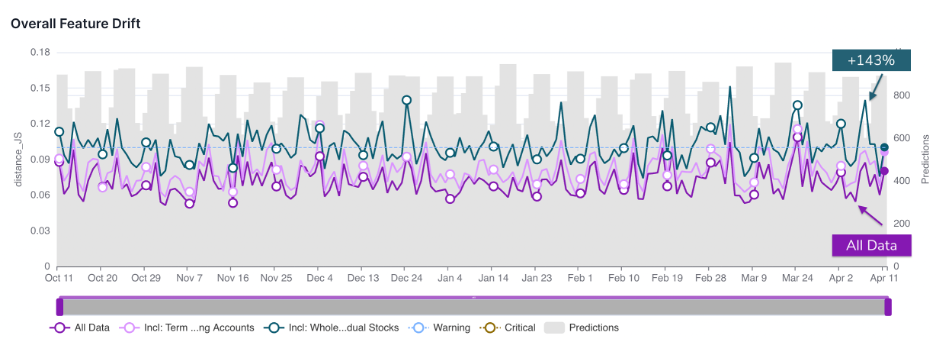
During a six-month timeframe, the segments for Auto and Homeowner Insurance exhibited a significant increase in drift compared to the broader model. The average total weighted drift for these segments was +433%, highlighting the importance of monitoring these areas of the business separately. Without explicit segmentation, this valuable information would have been obscured by the overall model drift (indicated as All Data in the picture below), making it difficult to identify and address the risk within these specific areas.
Similarly, other segments such as Health Insurance, Life Insurance, and Stocks showed an average increase of +202% in total weighted drift compared to the overall model. In addition, the segments comprising Mutual Funds, Bonds, and Commercial Banking also revealed a substantial increase, with an average of +189% compared to the overall model drift.
Further demonstrating the value VIANOPS segmentation capabilities, another day-over-day policy focusing on a segment comprised of Whole Life Insurance, Savings Accounts, and Individual Stocks yielded noteworthy results. Over the six-month period, these transaction types exhibited an average total weighted drift of +143% when compared to the broader model. This significant increase in drift highlights the importance of monitoring these specific transaction types as separate segments.
Identifying this unique and specific risk would not have been possible by only monitoring the model as a whole. The ability to segment and analyze different areas of the business enables users to uncover hidden patterns and risks within the data, allowing for a more targeted and effective approach to addressing drift and maintaining model performance.
Model Performance Metrics
VIANOPS can also track key performance metrics, including accuracy, balanced accuracy, precision, recall, and F1-score, to ensure the effectiveness of deployed models. Users can also analyze the performance of specific data segments, which allows them to understand the differences in histograms, performance, and drift at more granular levels.
Flexible and Agnostic Approach
VIANOPS takes an agnostic approach to model inferences, enabling users to develop and deploy their preferred models. This flexibility allows for a wide range of applications, accommodating various model architectures and ensuring compatibility with different systems and tools.
API-Driven Development and Jupyter Notebook Integration
A key aspect of VIANOPS flexibility and adaptability comes from its API-driven development. While the user interface is very appealing and user-friendly, the core functionality is powered by a set of well-designed APIs. This allows users to easily integrate our solution into their existing workflows and systems, making it highly extensible and customizable to various use cases.
Our credit card fraud solution was developed within a Jupyter notebook, which serves as both a development environment and a powerful tool for interactive data exploration and visualization. The integration with Jupyter notebooks provides data scientists with an accessible, familiar environment to analyze drift, evaluate model performance, and make informed decisions based on the insights derived from VIANOPS.
Conclusion
In summary, VIANOPS offers a comprehensive approach to monitoring drift in credit card fraud transactions, providing valuable insights into the performance of these models. Using various drift monitoring techniques, granular segmentation capabilities, and model performance metrics, this enables data scientists to identify and address drift in specific segments of their business, ensuring the deployed models remain accurate and robust.
The detailed analysis of segmentation over a six-month period demonstrates the effectiveness of our solution in uncovering hidden patterns and risks within different segments of the data. By explicitly monitoring segments such as auto and homeowner insurance, health insurance, life insurance, and individual stocks, users can gain a more granular understanding of drift behavior and make informed decisions to address specific areas of concern.
Additionally, VIANOPS API-driven development and seamless integration with Jupyter notebook provides a flexible and customizable platform to analyze drift, evaluate model performance, and make data-driven decisions.

