The Monitoring Platform for AI-Driven Enterprises
Engineered for precision and high-scale monitoring. Designed to fill gaps across homegrown tools. Function-oriented for deep insights and real-time access to alerts that matter. Meets the needs of every user, right where they are in their ML journey.
Built by a team of experienced leaders in innovation, VIANOPS is easy to use, and delivers reliability, scalability and premium functionality at commodity cost.

Models degrade, drift, have data quality issues, introduce or perpetuate bias. With VIANOPS, data science and ML engineering teams can create infinite policy types, set thresholds and activate smart alerts, to immediately detect problems.
Automate monitoring at scale.
Let VIANOPS surface patterns and insights buried deep in performance data – so you can get to root cause faster, and fix problems.
Build an affordable foundation for the future.
You’re running predictive models one day, and then next it’s generative AI the next. Whatever you need to do, VIANOPS delivers fast-start, easy-to-integrate high-scale monitoring at the lowest cost.
Explainability
Understand Feature Importance – Explainability
-
- Understand which features are responsible for the decisions made by the model.
- Drill into which features are more important and which are less important.
- Run what-if simulations to understand how features impact predictions.
Custom Metrics
Add custom metrics to the out-of-box performance metrics provided by VIANOPS, to create customized performance metrics that meet specific needs.
Monitor model performance using custom metrics and get smart alerts to proactively detect model performance degradation.
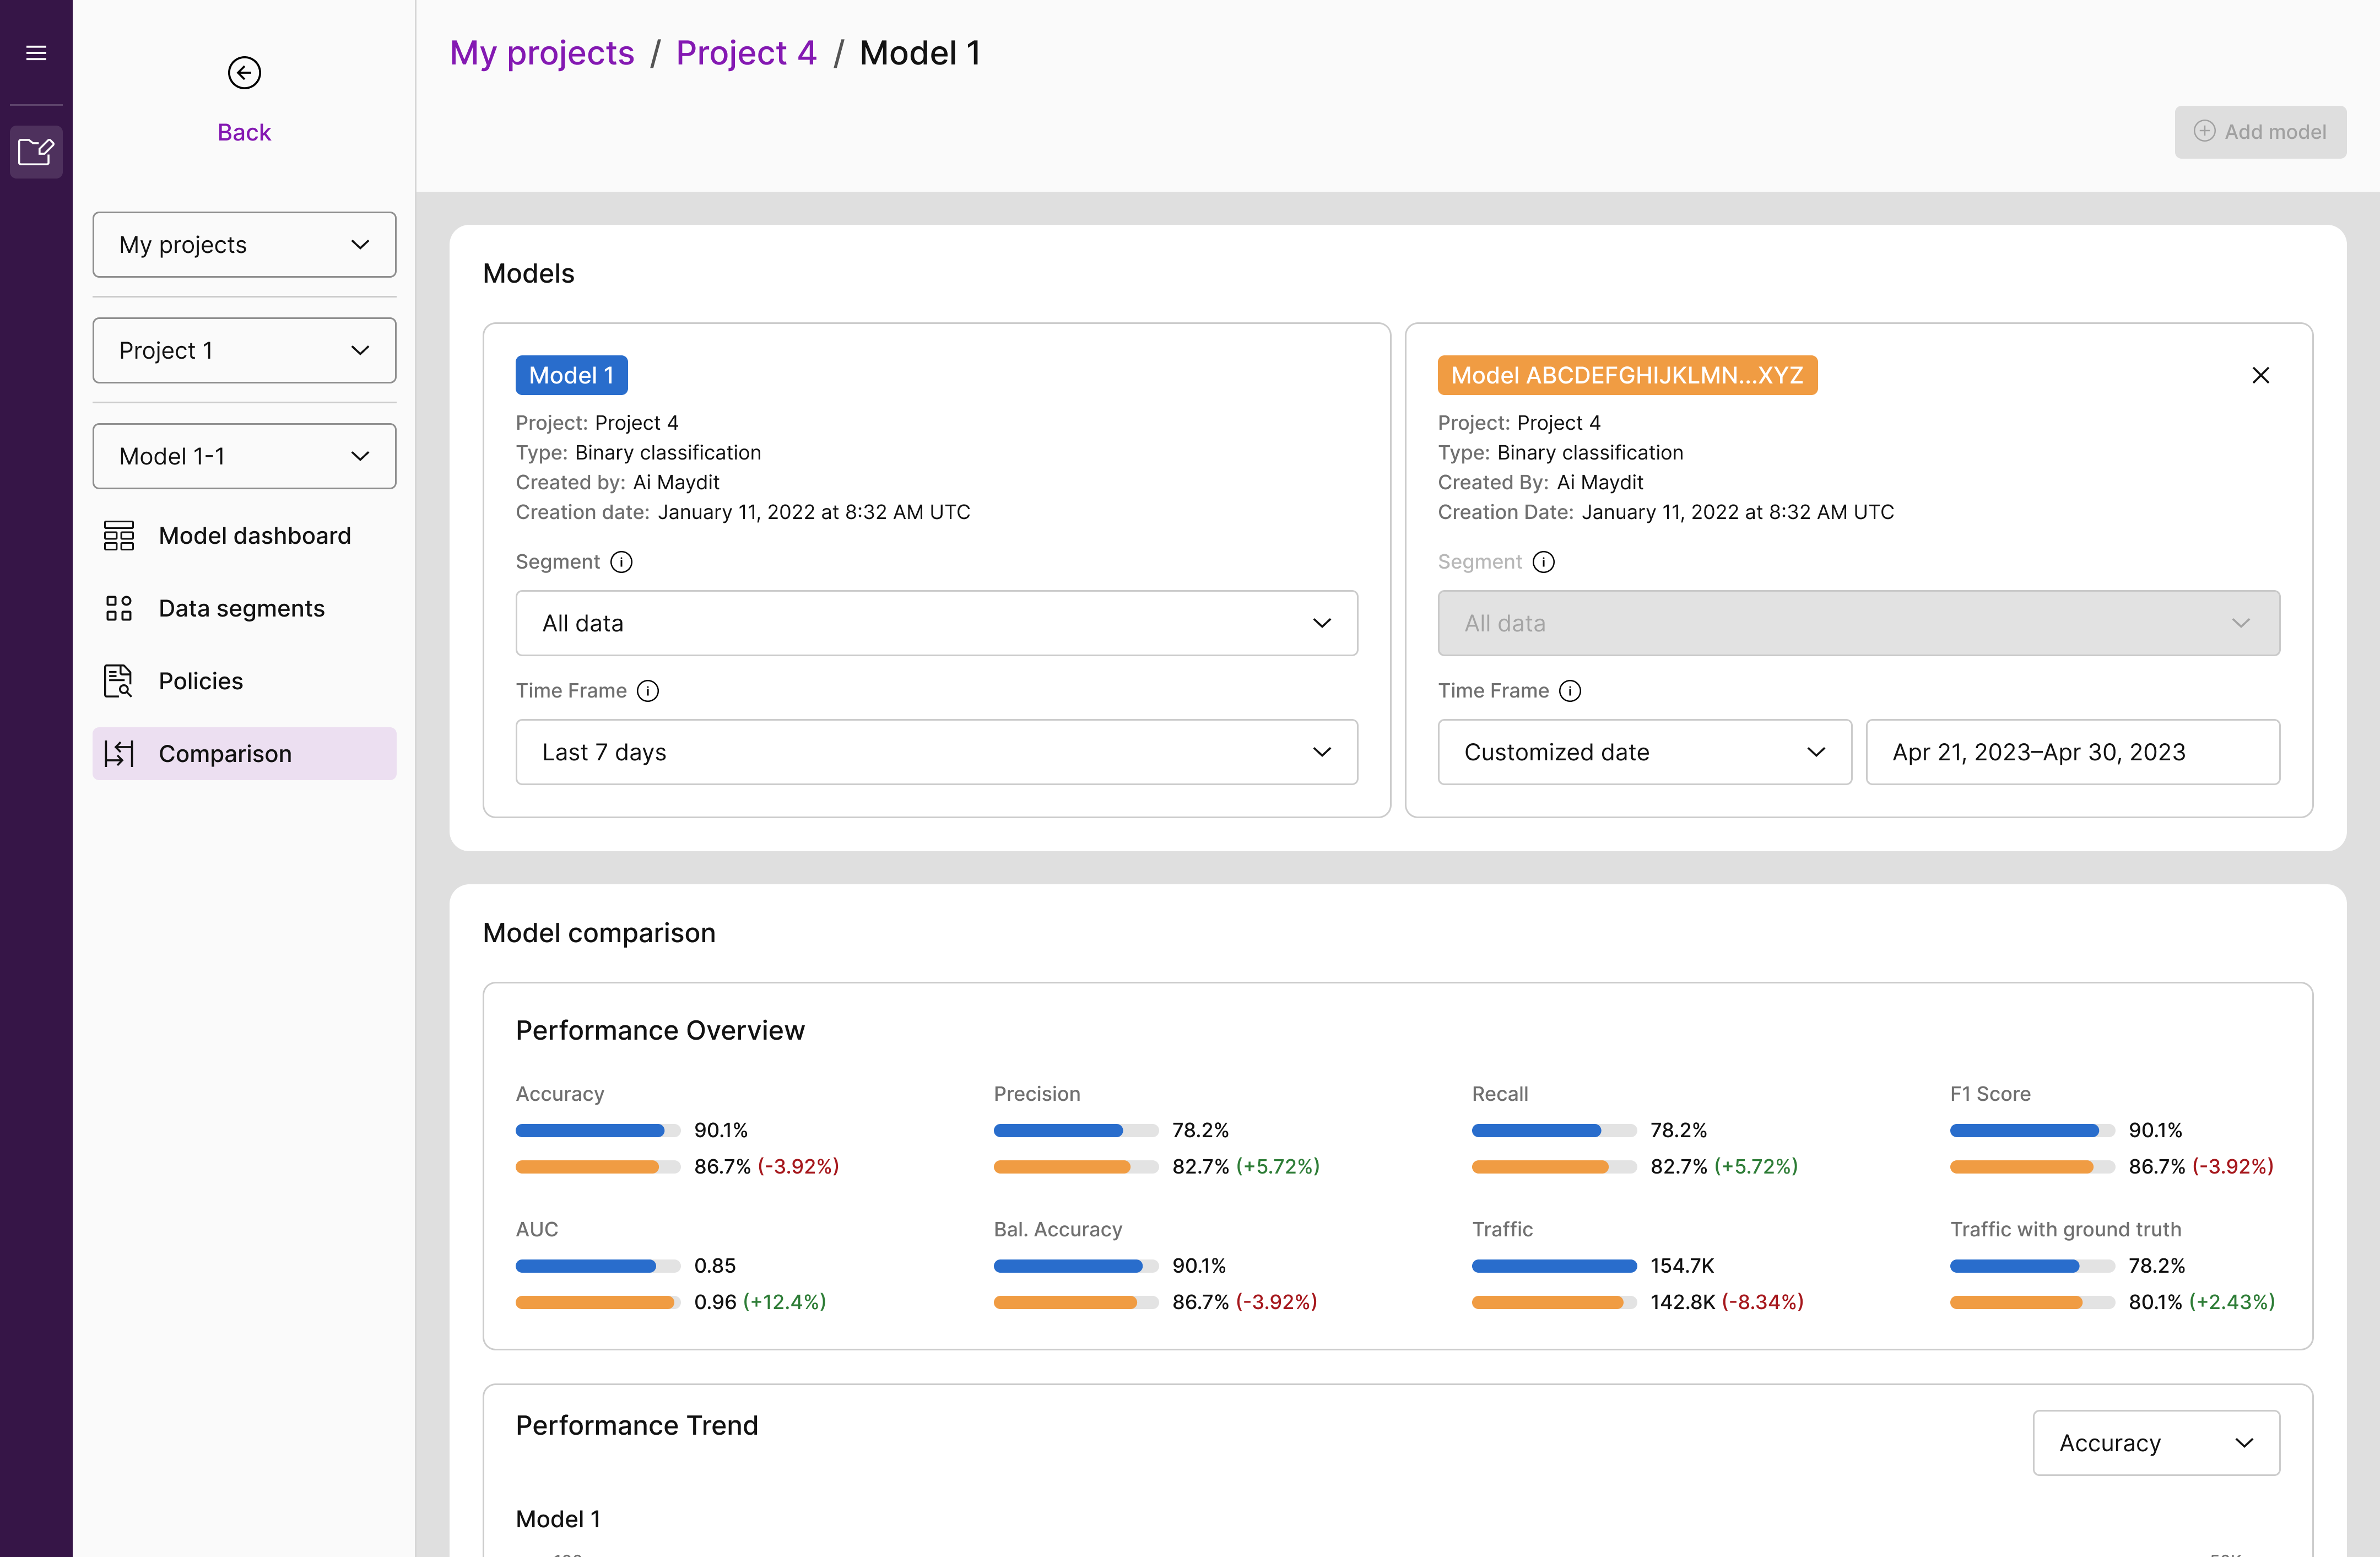
Model Comparison
Model Comparison
Compare models with similar inputs and outputs to benchmark, evaluate and assess overall performance and behavior.
- Ensure new models and challenger models are performing as expected
and no new risk introduced before onboarding - Identify recommended thresholds for warning and critical alerts based on historical data analysis and data from different time periods for the same model
- Use comparison metrics including Sensitivity (to inputs), Robustness, Fairness & Bias
Model Comparison
Model Comparison
Compare models with similar inputs and outputs to benchmark, evaluate and assess overall performance and behavior.
- Ensure new models and challenger models are performing as expected
and no new risk introduced before onboarding - Identify recommended thresholds for warning and critical alerts based on historical data analysis and data from different time periods for the same model
- Use comparison metrics including Sensitivity (to inputs), Robustness, Fairness & Bias
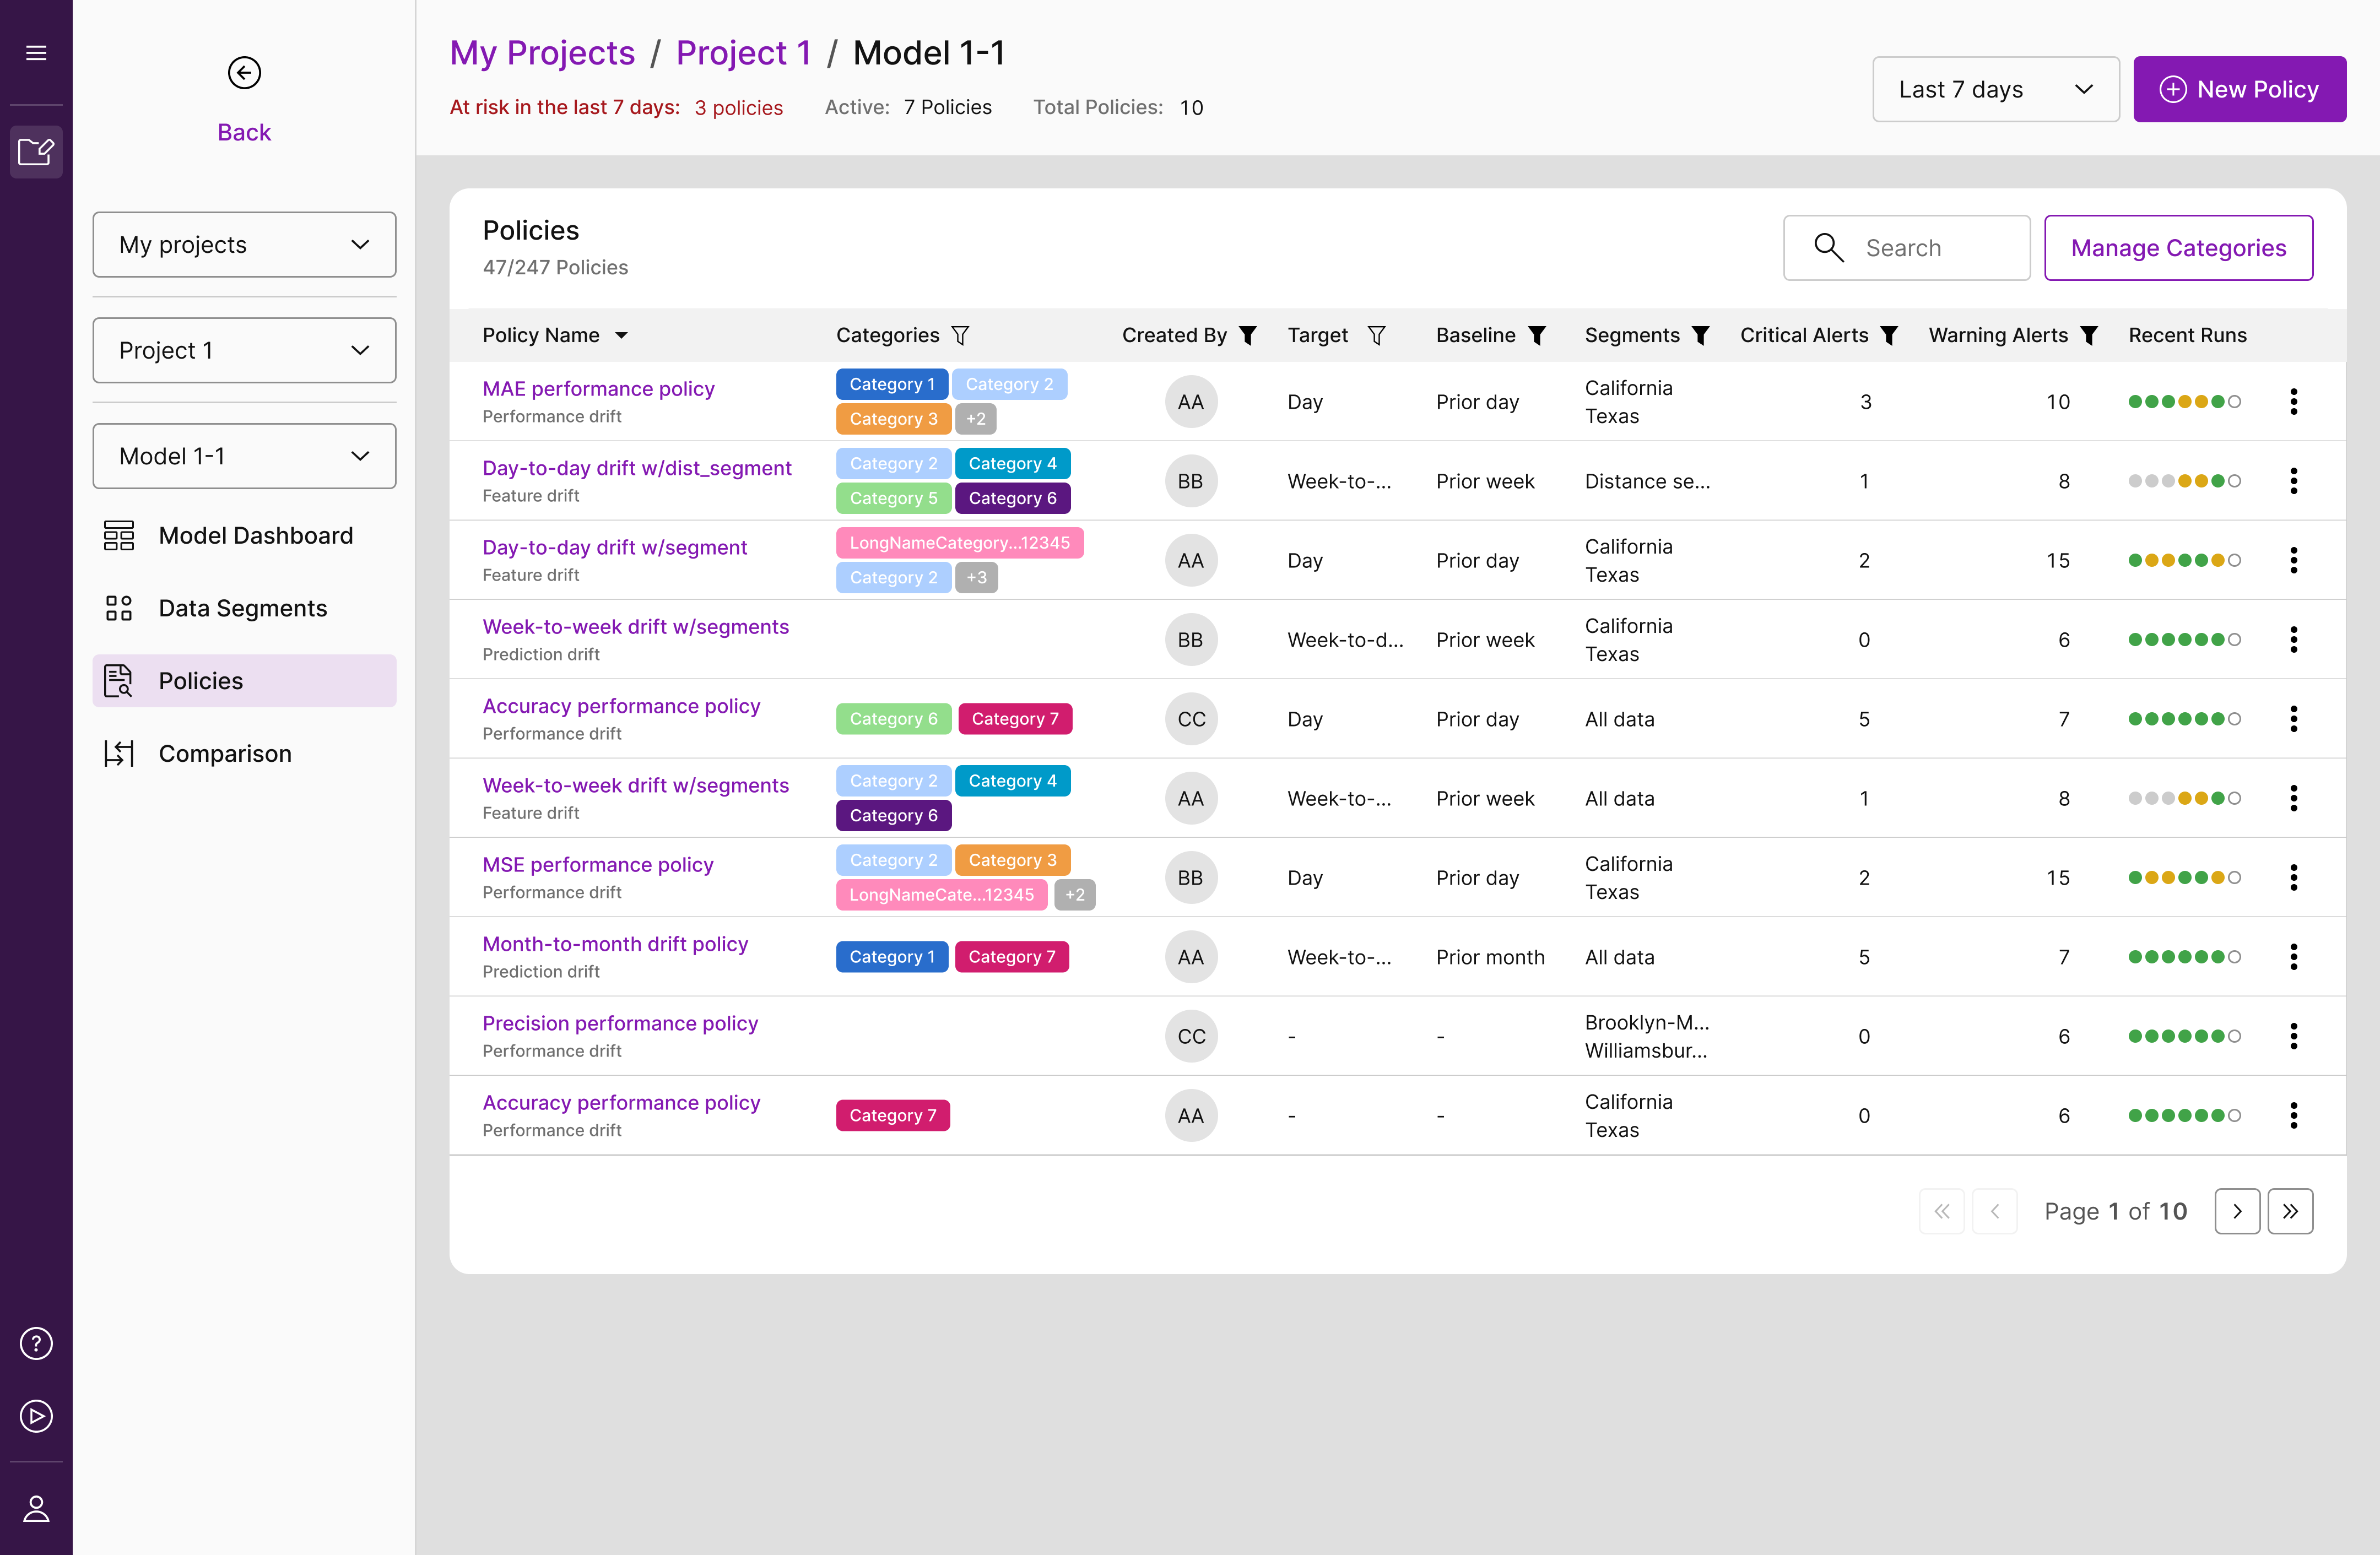
Policy Management
Easily manage, access, and track multiple policies for each model for the most comprehensive, efficient, and proactive insight into model behavior and performance.
- Create an infinite number and type of policies for models
- Create different policy types across features, metrics, segments, hotspots and more
- Quickly access, sort, and manage policies with the critical alerts that matter most
VIANOPS ML Process Flow
VIANOPS is the purpose-built platform that uniquely supports scalability across a large number of models, features, segments & data volumes in a cost-efficient way
VIANOPS ML Process Flow PDF
Click here to view our ML process flow as a PDF
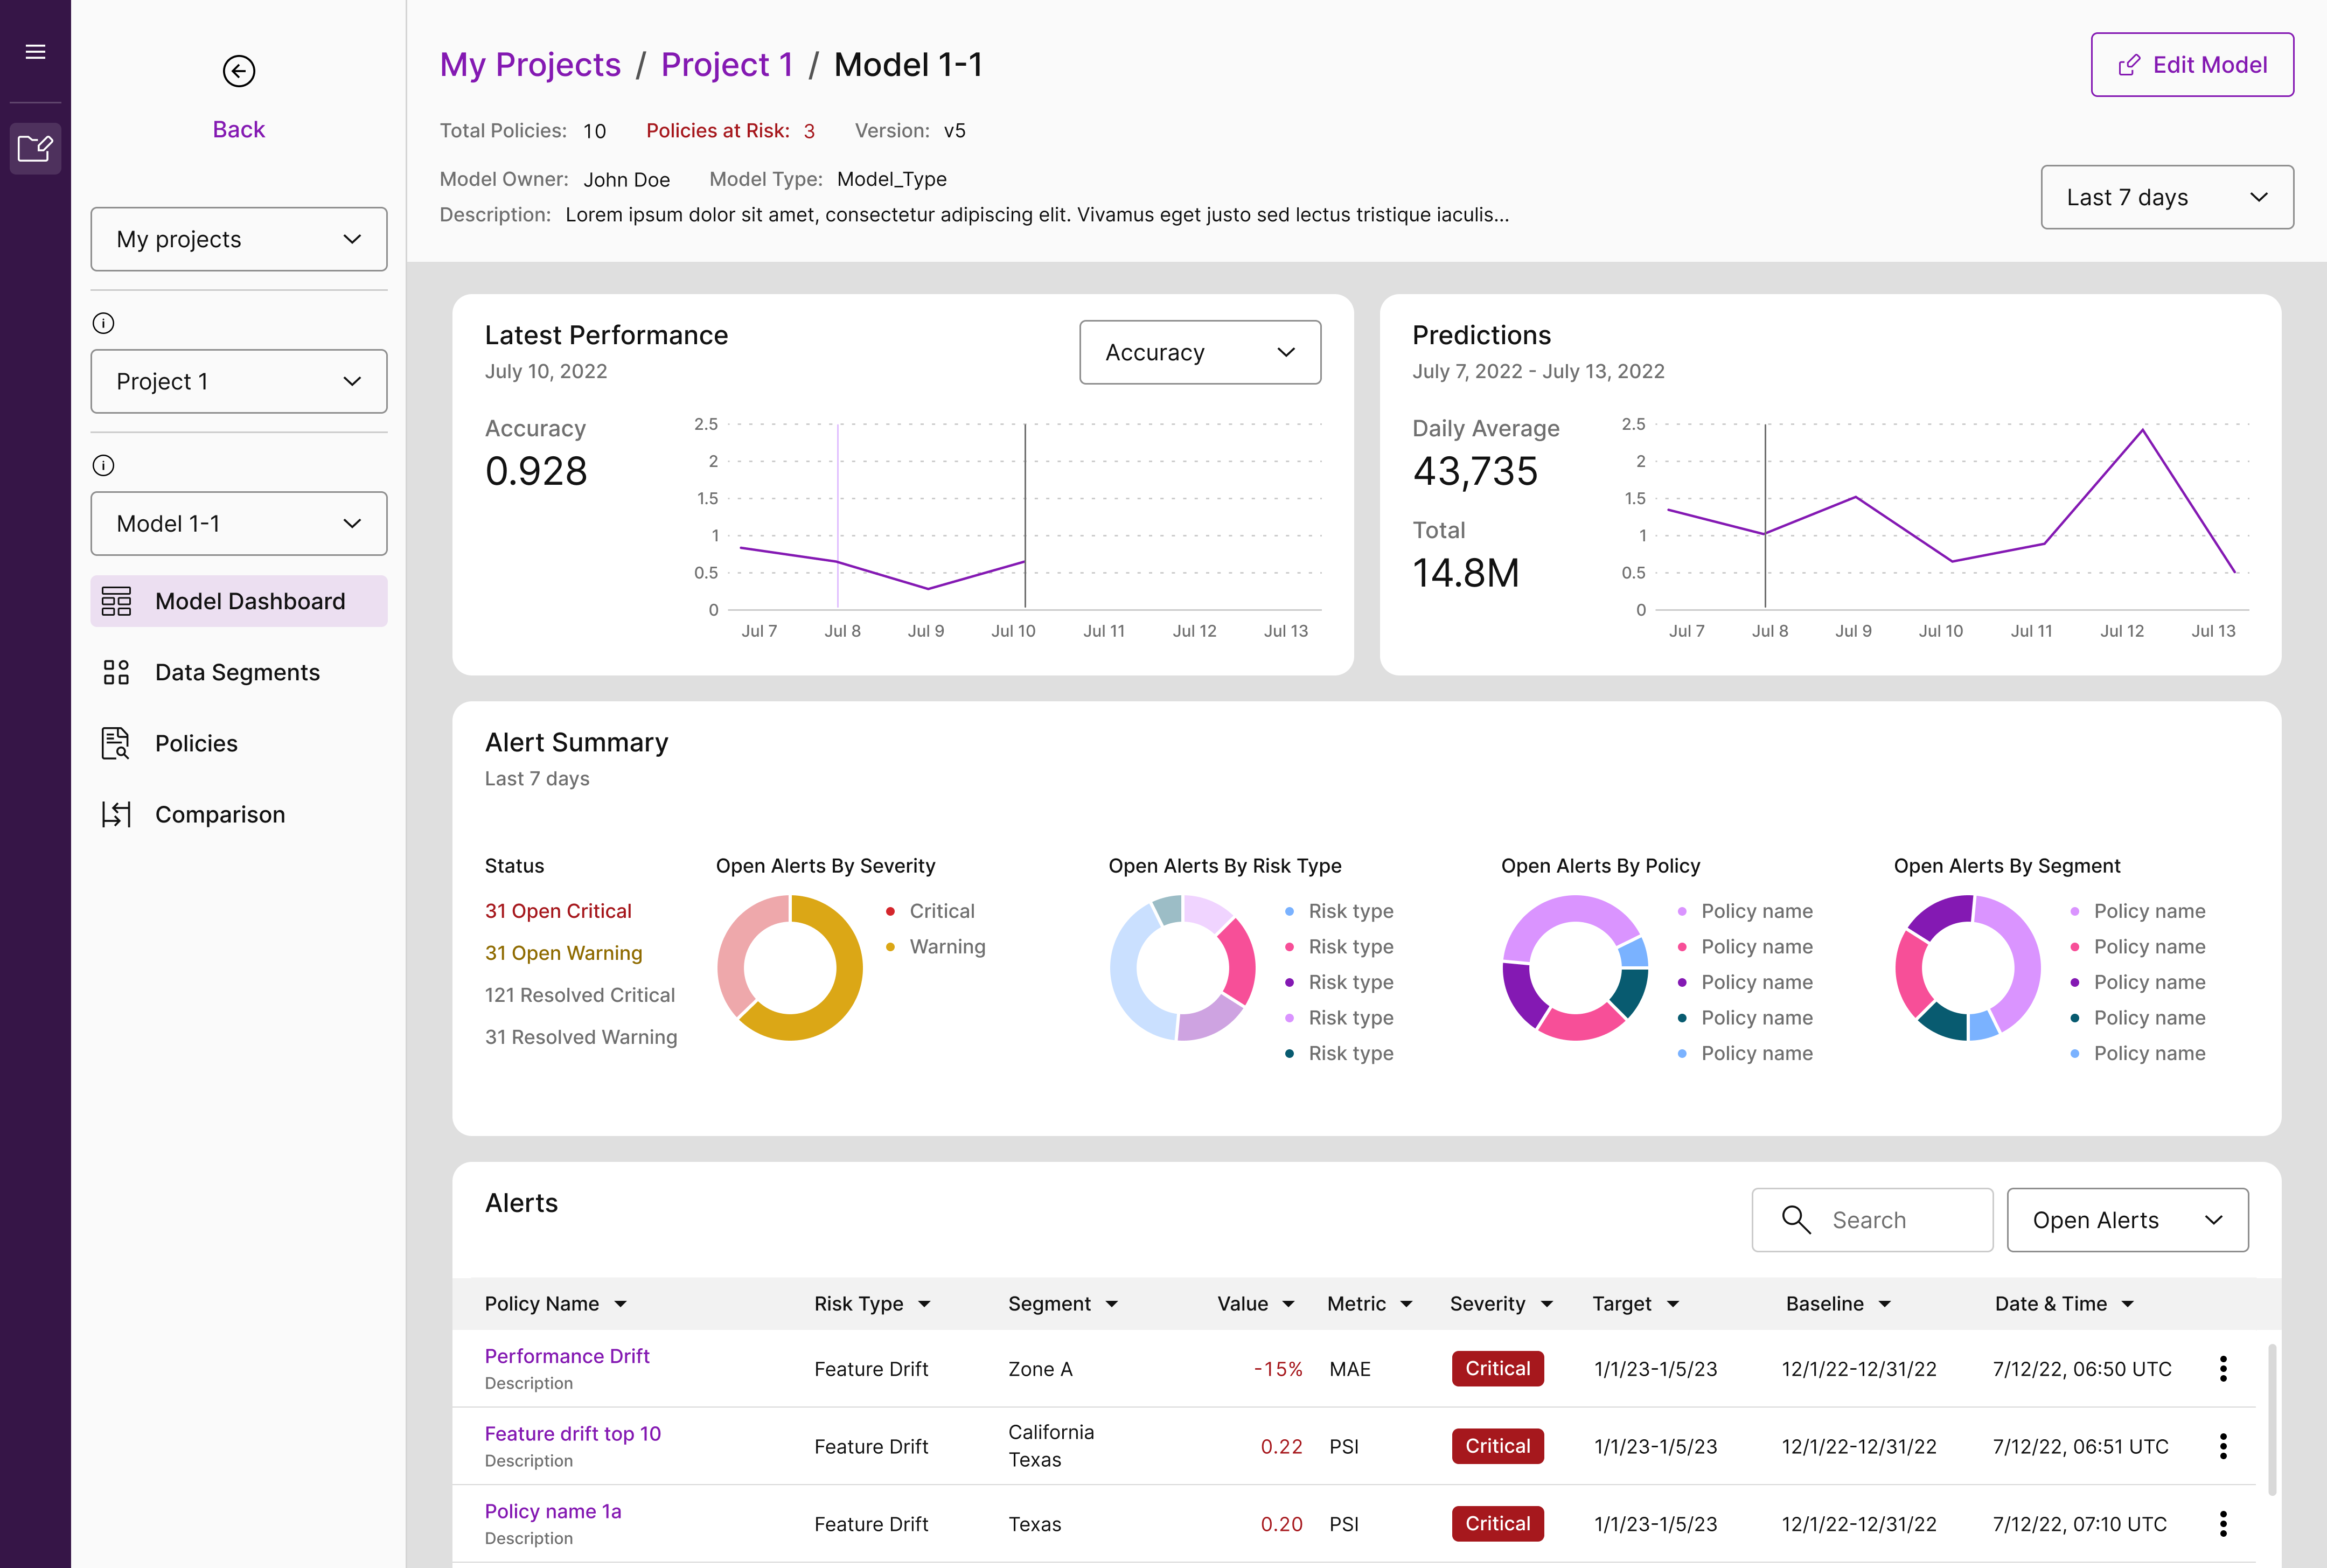
Model Dashboard
View and monitor models from a unified, collaborative dashboard.
-
- Quickly visualize and analyze model performance, to address model performance degradation once deployed in production.
- Monitor models for drift related to data, features and/or predictions, beyond the threshold, baseline, and training values, in order to troubleshoot the cause of drift and address model degradation.
- Proactively identify model bias issues across sensitive attributes, to ensure models are fair and bias-free.
- Understand which features are responsible for the decisions made by the models, to determine the efficacy of models.
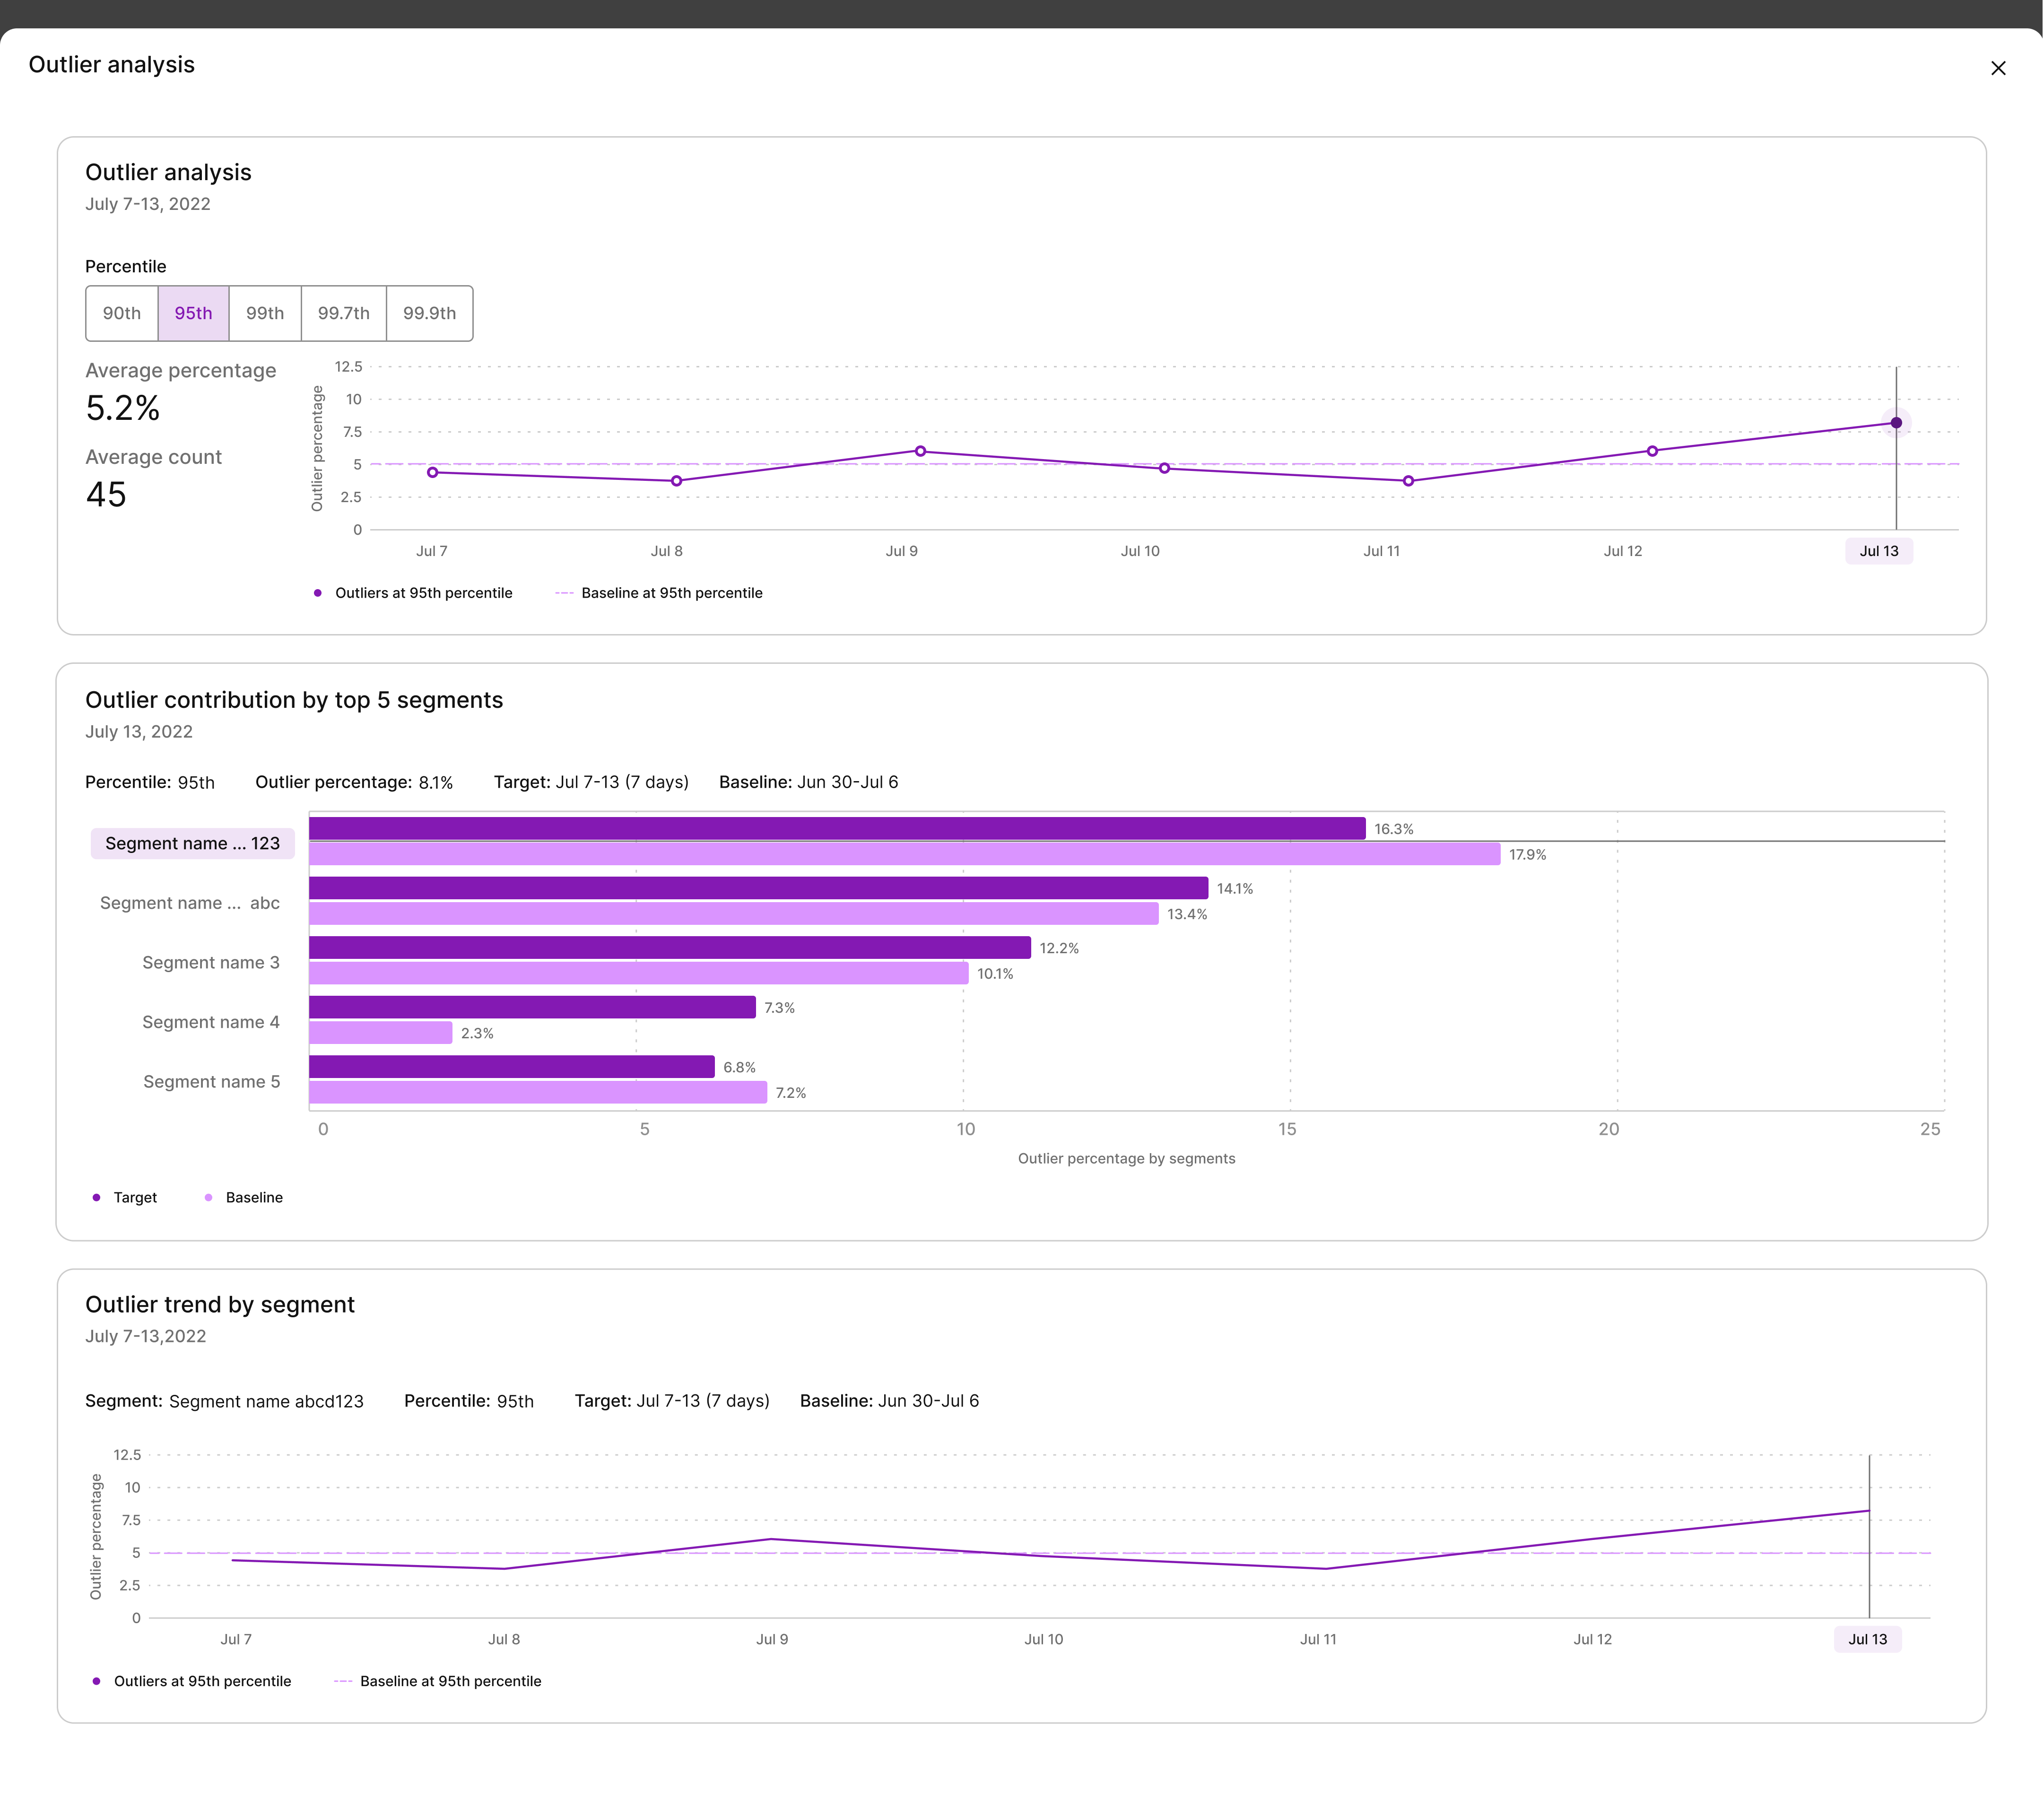
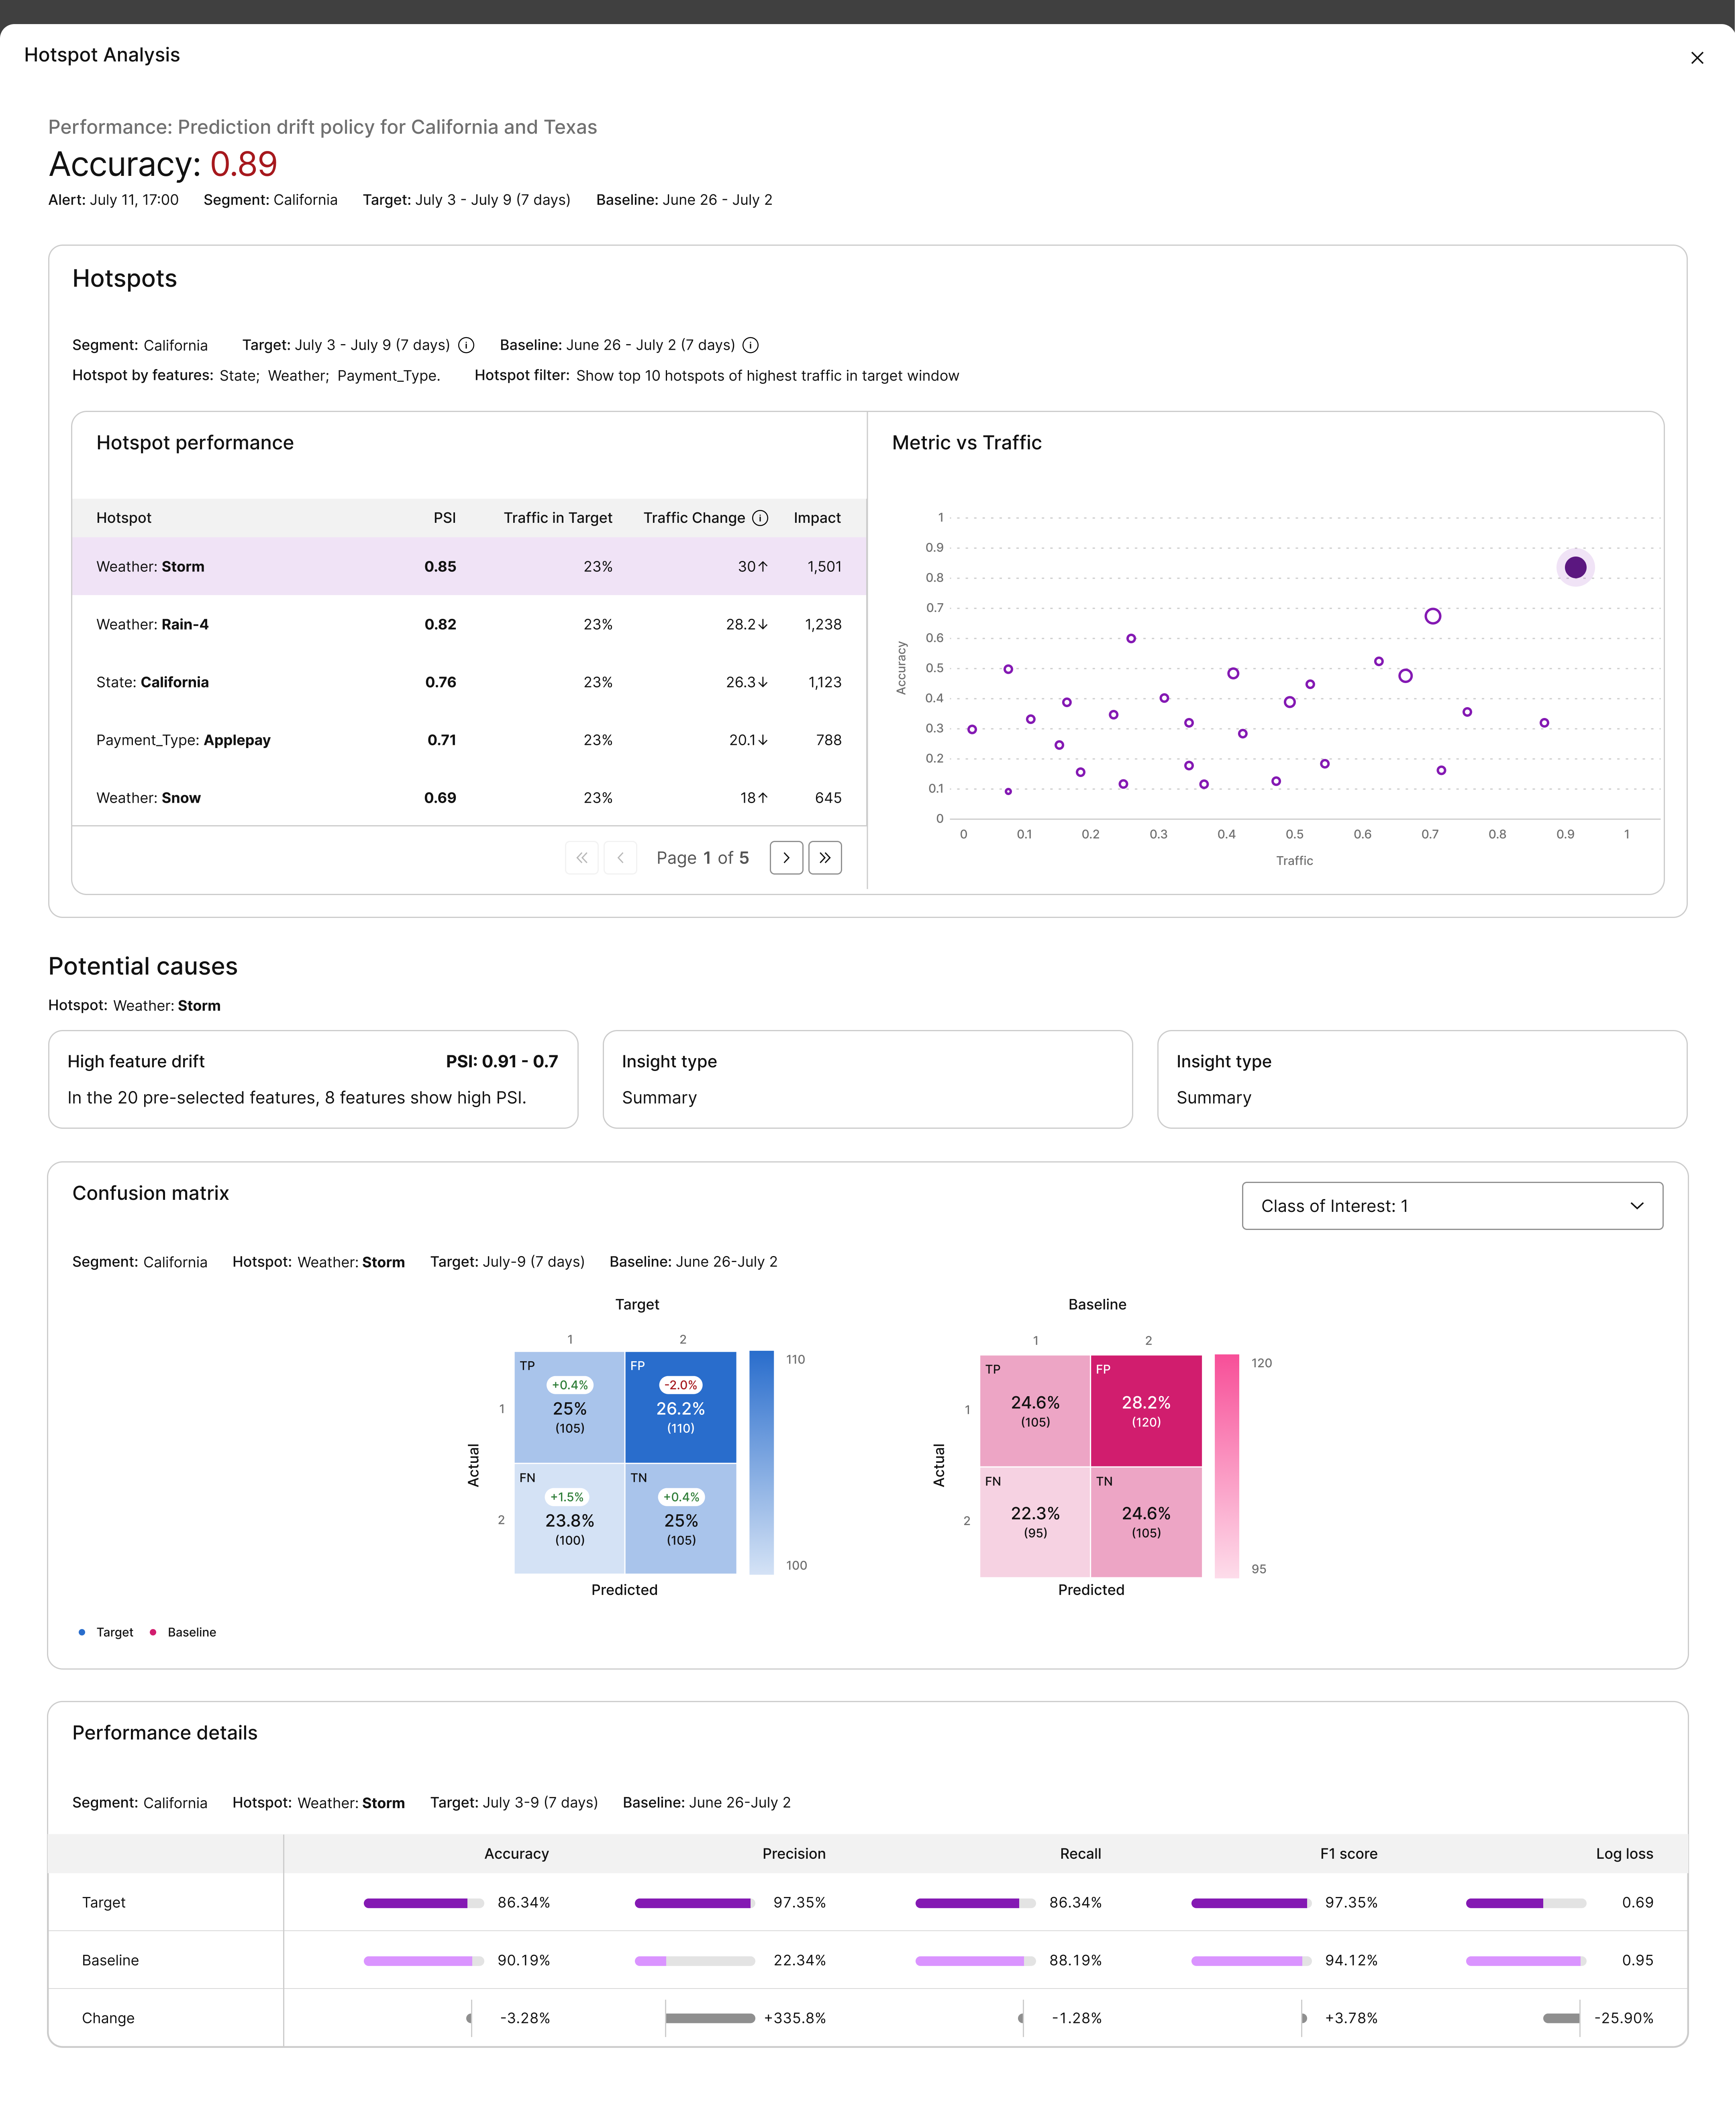
Root Cause Analysis
Troubleshoot with Root Cause Analysis (RCA).
Hotspot detection and analysis.
- Observe drift from different angles and levels of granularity.
- Correlate features drift to predict drift or performance degradation.
- Slice data into segments to understand model’s behavior and troubleshoot the cause.
Operationalizing Trusted, Transparent, ML Models At Scale – While Minimizing Costs
Easy integration via APIs
VIANOPS allows for seamless integration to your infrastructure. We create a frictionless experience to boost efficiency.
Data Sources
File Systems, Streaming Data, Feature Store…
Workflows
Airflow. Jenkins..
MLOps platforms
AWS Sagemaker, Databricks…
Collaboration tools
Email, Slack…

